Expert Advice with Jeremy Sheppard. 13/12/2015
Some of this advice was easy to ignore – it was from developers with a vested interest. “Brisbane follows Sydney by 18 months” they said. It had been more than 18 months since Sydney started its growth phase, so I guess it was a good time to spin that unfounded nonsense.
Some of the “advice” was from independent data providers and major real estate franchises with offices around the country. They had little to gain apart from some media attention.
But these remarks were merely the last straw in a long line of B.S. about Brisbane I’d been hearing since 2012. It got a bit louder in 2013. It got even louder in 2014 when Sydney price growth was unfettered. By early 2015 it finally got to me.
Sooner or later they will be right about Brisbane. But how long must an investor wait, paying interest on a loan before some significant growth in Brisbane occurs?
So I wrote a blog on the Supply and Demand in our capitals called, “Where to after Sydney?” I outlined why Brisbane was unlikely to outperform Sydney and why 2015 was still going to be a year of Sydney at the top. You can read the blog here.
So how did it all pan out and where to for 2016.
Back in March 2015
Brisbane was not the stand-out performing city in 2013, 2014 nor 2015 – Sydney was. The reason why was of course due to the balance between supply and demand as it always is.The following chart shows the average DSR+ (Demand to Supply Ratio) for each of the state capitals as they were back in March 2015.
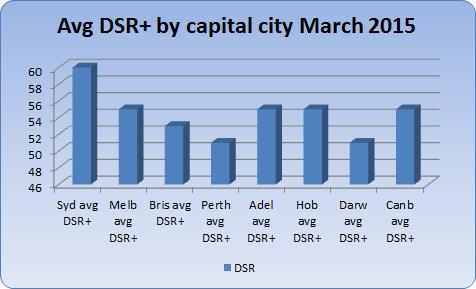
The DSR+ is a combination of 17 capital growth forecasting indicators. As you can see Sydney was way out in front. This meant it was the market with the most demand relative to supply of all the cities.
And as the year unfolded, the capital growth matched that forecast. Sydney’s growth outperformed all other cities. And Brisbane’s growth was “disappointing” in the words of Dr Andrew Wilson of Australian Property Monitors.
Where to from Nov 2015?
Nothing subdues demand like sky-high prices. So it is no surprise that the demand to supply ratios look a little different now at the end of November 2015 – see the next chart.
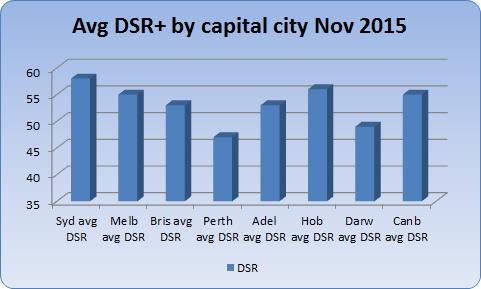
Although Sydney is still top of the pops, there’s not much in it now. And interestingly Hobart is showing a lot of promise despite all the negativity about Tassie’s economy.
One of the big arguments for Brisbane was affordability. Well if that’s a drawcard, then Hobart trumps Brisbane. And on top of that yield is so much better.
One of my clients was adamant he wanted cash-flow positive property. The best markets I could find with good DSR+ and a suitable yield were all in Hobart.
Anyway, you’ll note that Brisbane’s DSR+ hasn’t improved much over 2015. So it will probably get much the same rate of growth as it had in 2015.
Also, note that Perth and Darwin are stand-out cities to avoid. But that’s not to say there won’t be any opportunities in those cities. Remember these are average DSR figures.
Putting the stats in perspective
I don’t spend too much time gathering information like this at the city level. I don’t like to be drawn into this debate usually because it’s not a study I find useful for my own investing or for my clients.I can’t buy Sydney. I can’t buy Canberra. I can’t even buy a whole street in one suburb of one city. So the macro market of a city is of no use to me. What’s important is the micro-market data at suburb level.
The charts above showed the average DSR+. The chart below shows the average as well as the min and max.
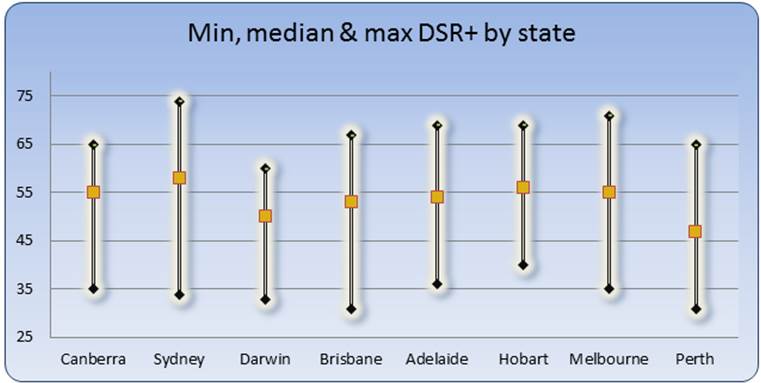
Pop quiz - which of the stats above is the most important for an investor to look at: the average, the minimum or the maximum?
Answer: Given we can’t buy a city, the average is irrelevant. And given we don’t want the worst markets the key stat is therefore the maximum DSR+.
This sits at 74 out of 100 and is still in… Sydney. This means there is at least one really good market left in Sydney that should outperform markets elsewhere around the country over the next 12 months.
It also means Sydney’s strong run is not quite over despite all the suggestions that “it’s done”.
The above chart also shows that there is at least one market in Perth that is likely to outperform the average for Sydney over the next year. So despite how negative Perth in general is, careful choice of a good suburb in a bad city will outperform a poor choice of suburb in the best city.
BTW: the reverse is true for property selection. That is, you’re better off buying the worst property in the best suburb than buying the best property in the worst suburb.
Conclusion
Those who bought in Brisbane early in 2015 instead of Sydney missed out on significant growth. A 5% difference in growth rate for a $500,000 property represents a mistake costing $25,000. But a typical growth investor who chose Brisbane over Sydney in early 2014 has made a mistake closer to $100,000 in opportunity lost. Now imagine the cost if you chose to accept that bad advice in mid-2012.Technically Brisbane is not a “no-grow-zone” as the title of this post suggests. More accurately, growth will occur but simply not at the rate investors should be pursuing.
Those investors wondering if it is too late to buy in Sydney should have no fear since there are still some great opportunities. It is still a preferred market to invest in over Brisbane for now. But sooner or later Brisbane will have its time at the top.
Lastly, don’t get sucked into the developer marketing hype about Perth being at the bottom ready to boom. You’ll be waiting for a lot longer than they suggest. If you have to buy there, then choose very carefully.
....................................................................................
 Jeremy Sheppard is head of research at DSRdata.com.au.
DSR data can be found on the YIP Top suburbs page.
Click Here to read more Expert Advice articles by Jeremy Sheppard
Disclaimer: while due care is taken, the viewpoints expressed by contributors do not necessarily reflect the opinions of Your Investment Property.
