Researching suitable property markets like a pro is not that hard. You don’t need a degree. The data is available online and very cheap, if not free. It won’t take you weeks. And you don’t need to be a genius either.
Where to start is often the biggest hurdle for most investors. But ironically this is the easiest part. The trick is to stay focused on the key drivers of capital growth and to use the latest technology. Information is everything. In this article I’ll provide a checklist you can work through to ensure you don’t make a monstrous mistake. It’s simple, effective and quick. But don’t expect to knock it over in one coffee.
Limitations
Research is a huge topic, so I’m going to limit the content here to the quick and easy procedures, the ones you simply must complete. This will give you the best bang for your buck.
I’m also going to limit research to one particular investment strategy – buy and hold. Adapting the process for other strategies should not be too hard. This might include strategies like: renovation flips, high cash-flow, development, and off-the-plan.
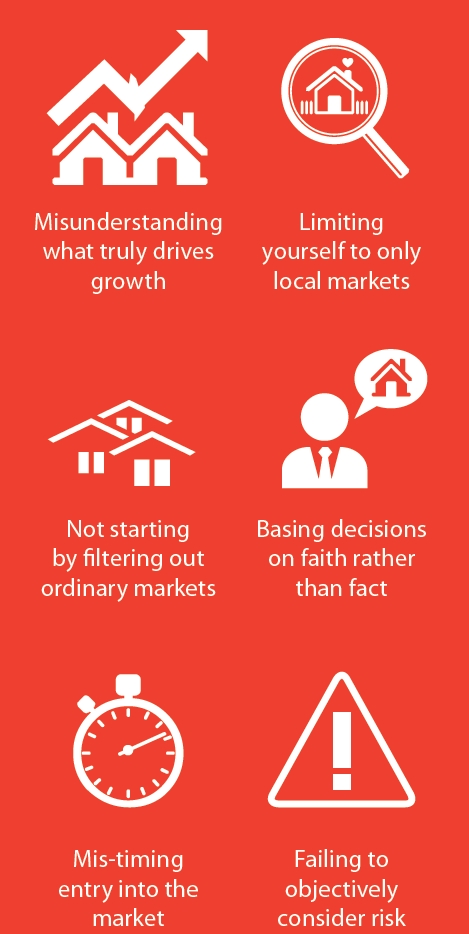
The big mistakes
The big mistakes I see investors making, and indeed that I have made are as follows:
Step 1. Understand what causes price growth
You’ve heard it many times before – price growth happens when demand exceeds supply. All your research needs to be directed towards determining demand relative to supply. There is nothing else to it.
Note that infrastructure projects, proximity to employment, population growth, development restrictions, interest rates, affordability and so on, all affect supply and demand. These are not separate categories. They all fit in one of two buckets: supply or demand. It really does only come down to those two factors.
Step 2. Understand how to determine supply and demand
How do you actually measure supply and demand? We need a consistent ruler to compare one market against another. We need a benchmark to tell if a suburb’s demand exceeds its supply.
I use statistics to quickly short-list locations in which demand currently outstrips supply. The stats are numerical which makes comparison easier. And they’re objective since an algorithm calculates them. And they’re consistent since the same algorithm is used for all suburbs.
After completing automated statistical research, I then perform further back-breaking manual research on those locations which the stats highlighted. This is to see which market is the best among them and whether an event is coming soon that might affect the indicators I used.
Early signs that demand is exceeding supply
If demand exceeds supply, you’ll notice some of the following symptoms:
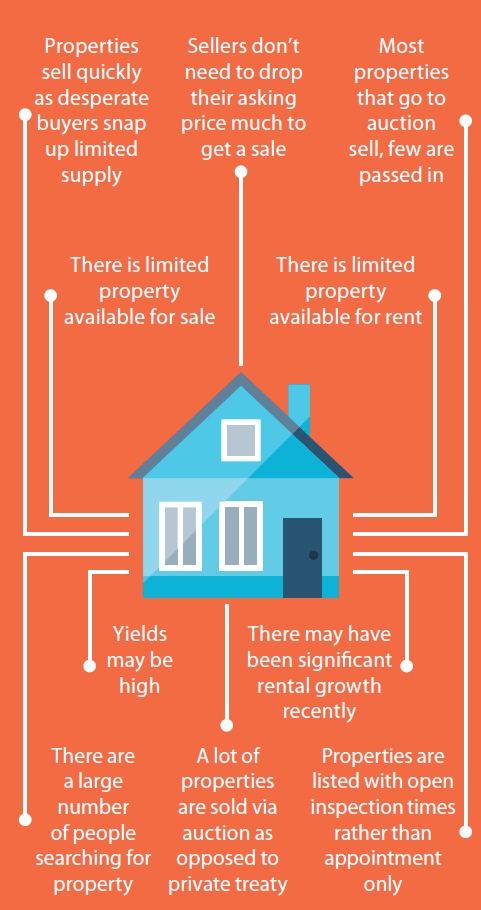
You may think that you’ve found a market like this. But how do you know there aren’t better ones, much better ones in fact?
Step 3. Look at multiple stats
There are statistics available online for all of the symptoms I just mentioned. These statistics can easily identify markets where demand exceeds supply.
Bear in mind that statistics can suffer from anomalies every now and then. Occasionally we hear of a vacancy rate of 10% which might not be realistic. And next month it’s back down to only 2%.
This is why you need to look at as many different stats as possible. Not all stats will have anomalies at the same time. It’s not until you’ve examined a market from every possible angle that you can get close to 'knowing' if it’s a good investment location.
The source I use to find markets in which demand exceeds supply is of course DSRdata.com.au. I use the Market Matcher to filter out suburbs that are beyond my budget; have poor stats; are too remote; have the wrong property type and so on.
It might take me several minutes to set up my criteria and specify how I want my results sorted. But it only takes the database seconds to return a list of matching markets.
This is the quickest and easiest part of your research. For next to nothing in terms of time and money, you have eliminated more than 99% of the Australian property market.
You have filtered out the ordinary, and already have some great markets to choose from.
Demand to supply ratio (DSR)
The key statistic that summarises all the symptoms of a healthy investment market is the Demand to Supply Ratio (DSR). If it doesn’t have a score of at least 50, you should treat that market with some caution.
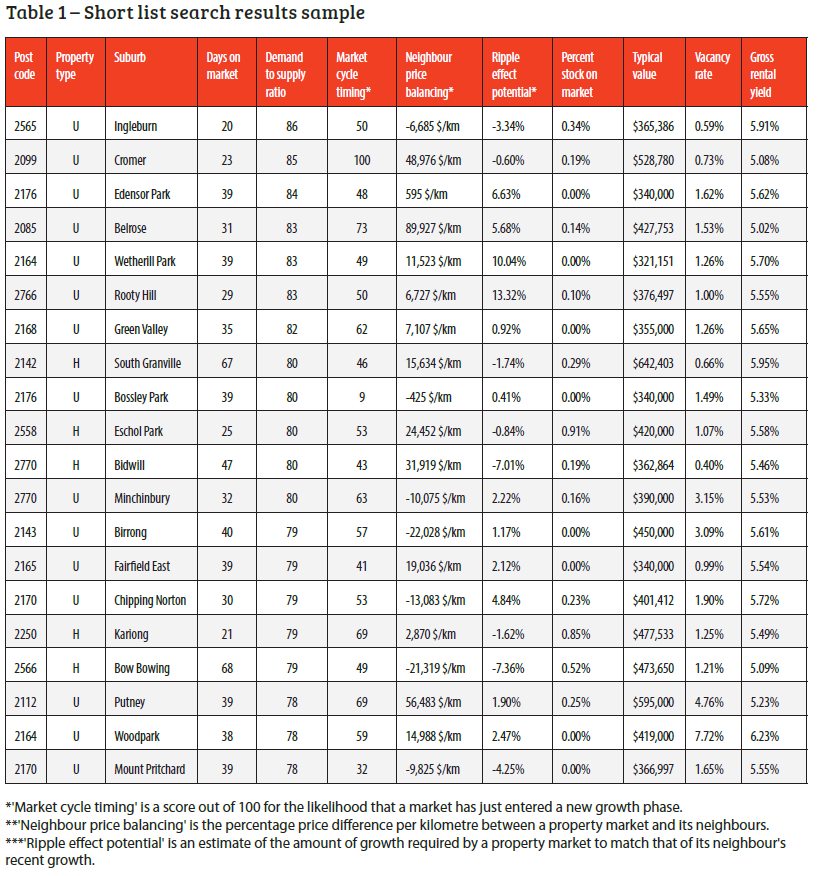
Table 1 shows a list of markets within 50km of Sydney that have properties selling for under $750k in March 2015 with a yield better than 5%. The list is sorted by DSR so the top of the list are markets with more growth potential.
The table contains only the top 20 markets ordered by DSR from best to worst. This may be a great filter, but you then need to go in-depth in your research. You need to examine each statistic for each suburb to see if perhaps one or two stats are worrying.
I’ve thrown in a few extra statistics of interest to me like the ripple effect potential. There are plenty of new stats to choose from these days.
Investors with a concern about risk might find some stats more important than others. Other investors might be purely after capital growth, while still others prefer to consider cash flow.
Step 4. Get the stats’ history
How do you actually measure supply? Some stats are volatile. That means their value jumps up one month and drops dramatically the next. A good example of this might be auction clearance rates.
Imagine there is a market in which four auctions take place one weekend. Three of the four properties sell while the fourth is passed in. So the Auction Clearance Rate (ACR) was 75%.
Next weekend there may only be two new properties auctioned but both sell. So the ACR jumps from 75% to 100% in the space of a week. How can we rely on figures if they’re so volatile?
The solution is to examine the history of each statistic. You need access to historical data in a chart to identify the average or more likely figure.
Case in point: Rooty Hill, Sydney
Chart 1 shows a good example. This shows the vacancy rates for units in Rooty Hill in Western Sydney.
You can see that the vacancy rates have been quite volatile from month to month. If there are very few unit rental properties in Rooty Hill and of those, very few available for lease, then you can expect the vacancy rate to bounce around quite a bit.
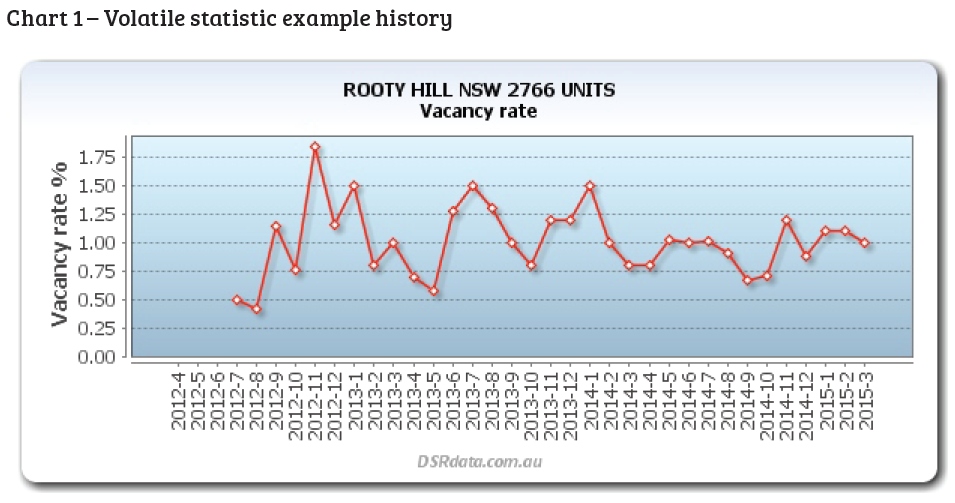
The overall vacancy rate for Rooty Hill units is quite good.
You can see from the chart that for the last few years they’ve never risen above 2%. A trend line might suggest the usual vacancy rate is around 1%. And there was greater volatility in late 2012 but things look like they’re settling down now.
- Always check the history for every statistic before assuming its value. The history of price change is a particularly useful indicator in Sydney right now.
- If you’re worried of buying at the peak, then choose a market that has not experienced strong price growth over the last one to two years.
Step 5. Do the fundamental research
Once I’ve verified the stats, I then start fundamental research. Fundamental research requires investigation beyond the statistics.
It’s the kind of research where intelligent interpretation of the data is important. An algorithm is unable to tell you which market is better. You need to apply your own smarts.
If you can remember to keep supply and demand in the forefront of your mind, you should do OK. Don’t worry if you don’t quite nail it. The research you’ve done up to this point already has you beating the odds.
- Start with the top markets from your earlier research phase
- Keep going through them until you’ve examined about 10
Step 6. Check out the council website
Your first stop in the fundamental research phase is to visit the website of the council governing over the suburb/s of interest. You’ll be looking for two things at this stage:
- Future supply
- Future demand
Future supply
Each council website is different, but most will have a page where you can view development applications.
- See if any developments have been lodged for the suburb of your interest. Remember that a council will preside over a number of suburbs.
- Examine carefully the nature of the development. Try to estimate the number and nature of new dwellings the development will create. For example, it could be a single new house or an entire housing estate. Or it could be a 10-storey block of apartments or simply a few extra townhouses.
- You need to know if there will be extra supply coming onto the market and how much. A new block of apartments might add 50 new units to the market. If there are only 50 units currently for sale, you can easily see that the supply will double.
Future demand
Councils may embark on projects which have a side effect of improving the demand for housing in the region. Some of the following may improve demand:
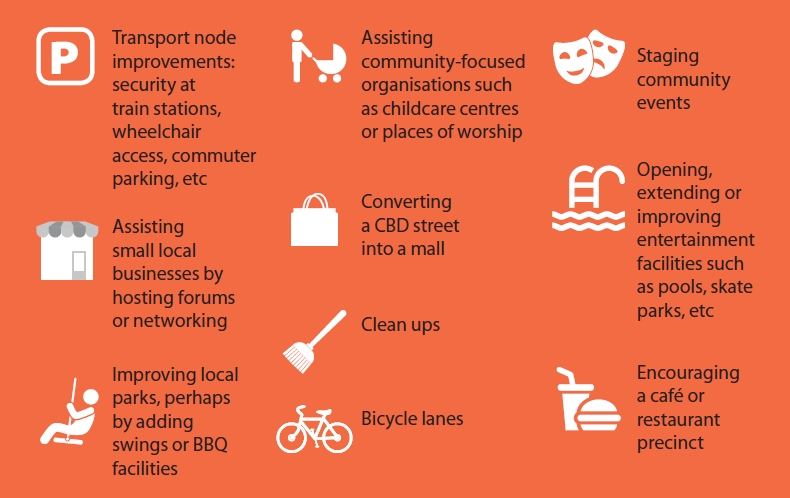
Step 7. Understand which projects would increase demand
Bear in mind that not all projects that council embarks on will improve demand. Offering to host the city’s new sewerage treatment works for example would be a definite negative.
A quick way to gauge each project’s impact on demand is to ask:
- Would this project make more residents happy or unhappy?
- Would it potentially draw a crowd or draw more complaints?
Once you know which way a project will impact supply or demand, the next step is to gauge by how much. This is extremely difficult to do objectively and stretches beyond the scope of this article. For now, you’ll just have settle for a guestimate.
Aside from the approval of development applications, the vast majority of projects that a local council embarks upon will virtually have no impact on housing supply and demand.
Developers are often desperate to find something positive to say about a location they’ve targeted for development. The reason they bought there was probably because of a good bottom line rather than long-term growth potential. What interest do they have in long-term growth potential if they’re selling?
Five million dollars worth of road works, for example, might include filling a few pot-holes and repainting the lines. People are not likely to move into an area simply because of that. But I’ve seen developers pump it up as a draw-card.
Step 8. Check the government spending in the area
A quick check of some of the state and federal government plans for the area in question might uncover some monumental project that causes huge change in the area.
- https://www.infrastructure.gov.au/
- https://www.infrastructureaustralia.gov.au/
- https://www.infrastructure.nsw.gov.au/projects.aspx
It’s unlikely you’ll find anything that directly affects your suburb of interest. But you should at least check.
Step 9. Check for private spending
Large private enterprises can add something to the economy of an area if they move in. A new Bunnings, McDonalds, Commonwealth Bank branch or Gloria Jeans, for example, means the suburb is gentrifying.
However, this doesn’t necessarily mean housing will be under pressure in the area. People are quite often happy to commute to work. They rarely move just to get a job at McDonalds, for example.
So don’t try to read too much into this kind of information. Only if a relatively large number of enterprises have recently moved into an area should it pique your curiosity.
Step 10. Map everything
Examine a map to find the best and worst spots. Look at satellite images as well as the street map. You may have to do a quick drive around, too.
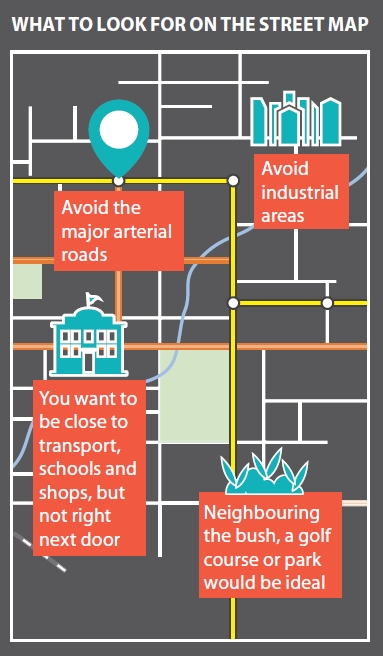
The more backyards that have swimming pools and decks, the more affluent the street and the more likely properties are owner-occupied. A heavy representation of owner-occupied dwellings means there is less chance of overcapitalising a renovation for this area.
The more cars parked bumper to bumper along the street, the more valuable an extra parking space is.
The leafier the streets, the more pleasant the atmosphere and the older the suburb is likely to be. Older suburbs can be a blessing or a curse to growth. Restoring homes can add tremendous value. But a suburb that has all the infrastructure it could possible desire has no room to change or improve.
Once again, don’t place too much value on what you find with this research. A swimming pool-intense suburb for example, may simply mean it’s in a hotter climate.
Step 11. Ask local agents
You can cut down the research time dramatically by speaking with the local agents. Here are some questions you may want to ask:
- What are buyers and tenants desperate for?
- What are they likely to queue up to see at an open inspection? Is it a onebedroom unit or a 5-bedroom house? Unfortunately, you’ll need to join the queue of buyers and put in a strong offer if you choose to buy here.
- You can also ask agents if there are any no-go zones like streets with a high concentration of state-funded housing or perhaps near a troublesome skate park that truant teenagers frequent, looking for trouble.
Summary
Half your battle is done if you can find a suburb in which a dozen or more stats are all positive. A very small percentage of property markets in Australia will have this.
The fundamental research is more time-consuming and less likely to reveal anything truly rewarding. But you have to do at least some of it or you’re taking a risk. The influence of a major infrastructure project can have a large and long-term affect. But there are few of them and they’re infrequent.
If you’re diligent and you focus on interpreting all the information with respect to its impact on supply and demand, you could be on your way to snagging yourself a winner.
Jeremy Sheppard
is a property investor, creator of the Demand to Supply Ratio (DSR), and a self-confessed capital growth research 'nutjob' at DSR data
