A lot of experts advise investors to steer clear of public housing. It’s supposed to be bad news for capital growth. But that’s been assumed, it hasn’t been researched.
According to my analysis of historical data:
“The level of government housing has virtually no impact on future capital growth rates”
Data from Census
Question 57 for the last few censuses has been one about who you rent your property from - assuming you rent. See image below.
You can see at the top right of the image, there is the option to specify that the property is rented from a real estate agent. And 2nd from the top is whether the property is provided by a government housing authority…
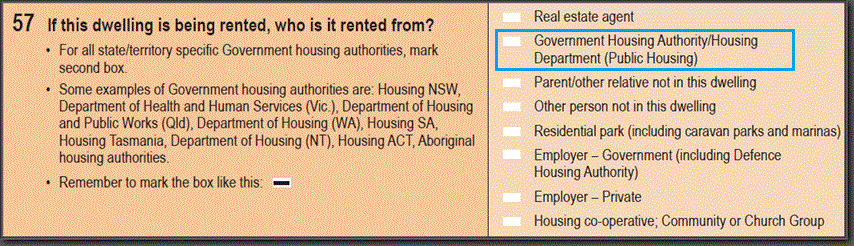
Analysing this data from the ABS, we can easily determine which suburbs have a higher concentration of public housing.
2016-2017 analysis
Let’s have a look at the data from the latest census (2016 at the time of writing).
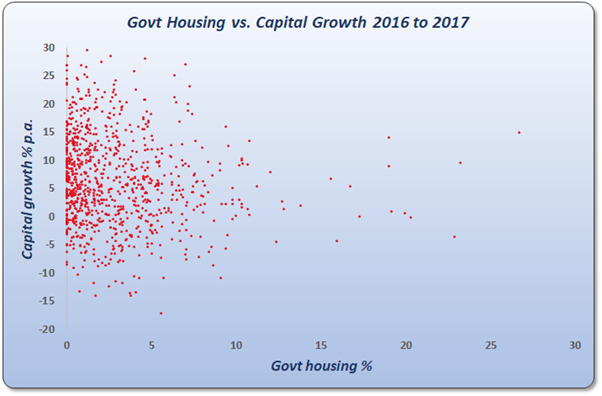
This chart is called a scatter plot. Each red dot is a suburb. I haven’t looked at every suburb in Australia, I’ve eliminated those with unreliable data.
The horizontal axis at the bottom of the chart shows the level of government housing. You can see the scale along the bottom, ranges from zero on the left to 30 percent on the far right.
If a red dot appears on the far left of the chart, it means the level of government housing is very low in that suburb. If a red dot appears on the far right, the level of government housing for that suburb is very high.
As you can see,
“Most suburbs have a very low percentage of state housing”
That’s why there are so many red dots bunched up over to the left of the chart.
The vertical axis up the left, shows the capital growth that occurred in each suburb from 2016 to 2017. The rate of growth is shown in the vertical scale running up the left edge of the chart. At the bottom left the numbers start from minus 20 percent and go all the way up to positive 30 percent which is shown in the top left corner of the chart.
Now, if the experts are right, then a suburb with a high concentration of government housing would appear to the bottom right of the chart.
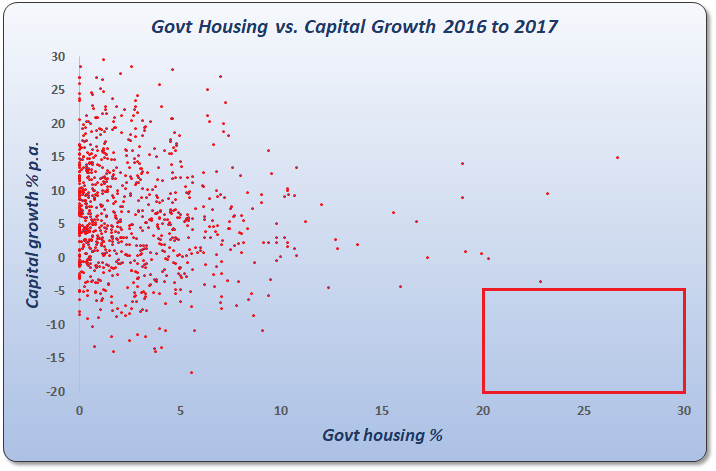
And the suburbs with no social housing would appear in the top left.
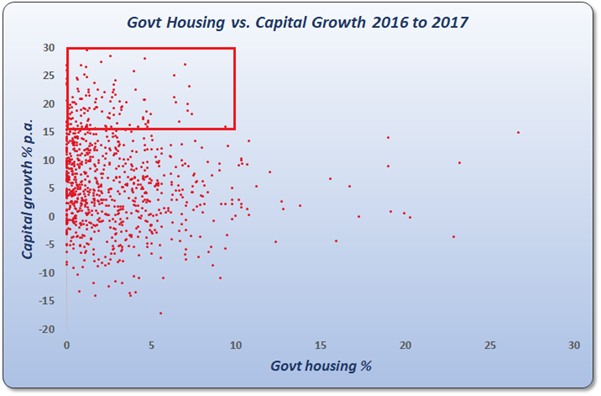
Although there are more dots in the top left, it’s not crowded with dots like other areas.
Just looking at the dots you can see there’s no real pattern or relationship between government housing concentration and 1-year capital growth. But a mathematically plotted trendline might help…
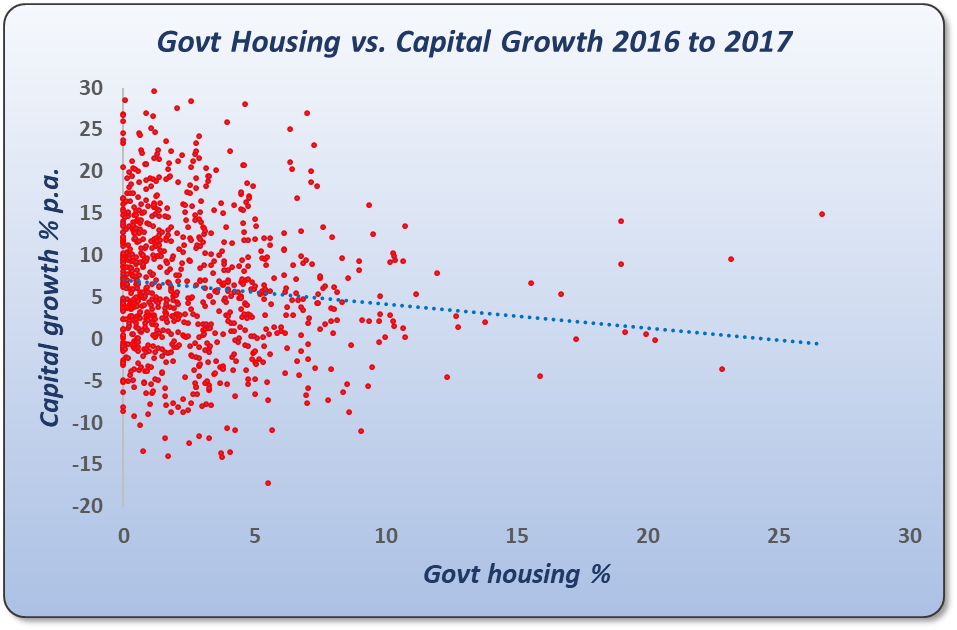
I’ve plotted a line of best fit. The blue dotted line you see on the chart now, called the “trend” line. There does appear to be a relationship, even if it’s only a gentle slope.
If the relationship between state housing and future growth was a strong one, the line would show a steep descent from the top left of the chart down to the bottom right.
So, according to this chart, there is an argument for the relationship suggested by the experts. But there’s a problem…
The Problem
This is looking at the capital growth that occurred 1 year after the census date. But:
“It often takes the ABS a year to publish the results”
As investors looking to find ideal suburbs to invest in, we would NOT have the data at the census date, we’d have it a year later.
2017-2018
So, let’s look at the 1-year capital growth starting a year after the census.
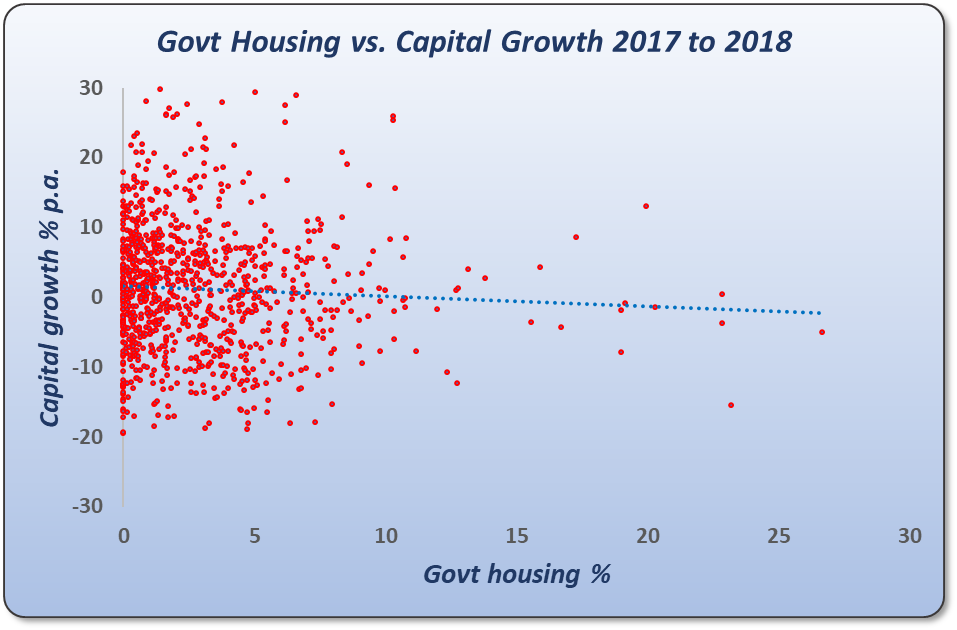
As you can see the line of best fit is even more gradual. In fact, you’d be better off by less than half a percent if you bought in an absolute zero state housing suburb versus one with about average state housing.
2011-2014
Let’s look at the capital growth over a 2-year period starting 1 year after census. Now, at the time I analysed this, we were just a few months short of 3 years since the last census, so I needed to use data from the prior census if we’re going to look at longer time-frames. So, this chart…
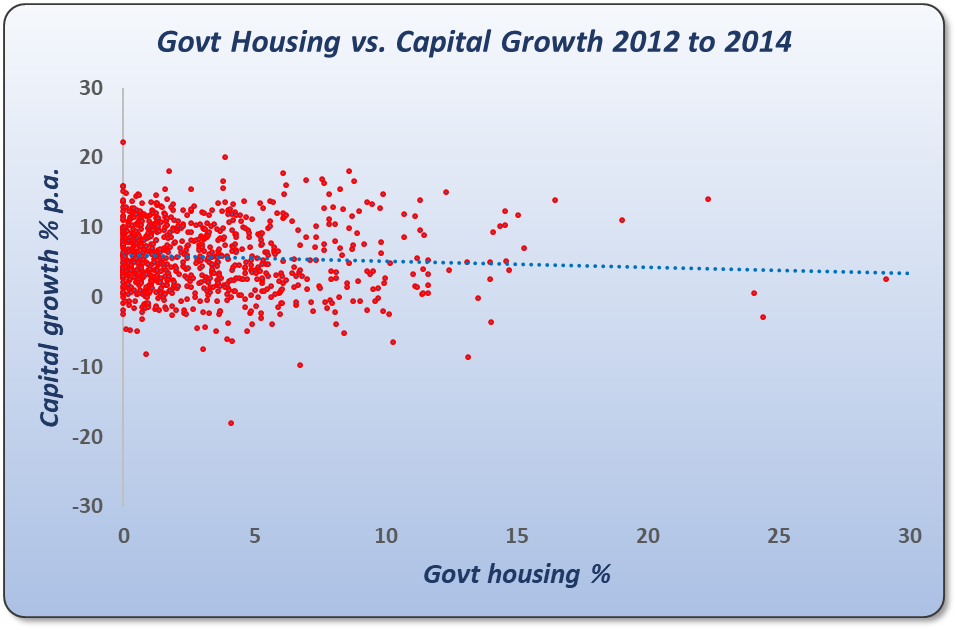
…is using data from the 2011 census.
This chart shows 2 years of capital growth starting 1 year after the 2011 census, that is, from 2012 to 2014. You can actually see that the line of best fit still has a very slight decline. But again, this is only over 2 years.
2007-2017
To squeeze in a longer view, we have to go back to the 2006 census.
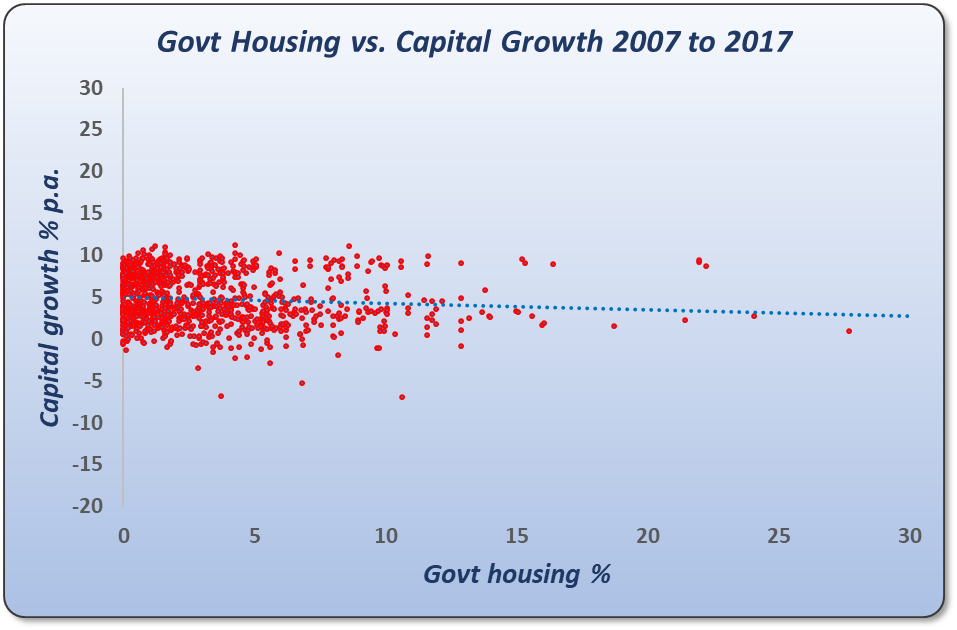
This chart shows the capital growth for the 10 years from 2007 to 2017. Remember, we’re starting the growth calcs a year after the census date to model the time it takes for the ABS to publish the data.
It is very clear from this chart that there is virtually no relationship between high concentration of government housing and future growth over a 10-year period. At least not according to the 2006 census anyway.
Change in govt housing
What about analysing suburbs for their change in percentage public housing?
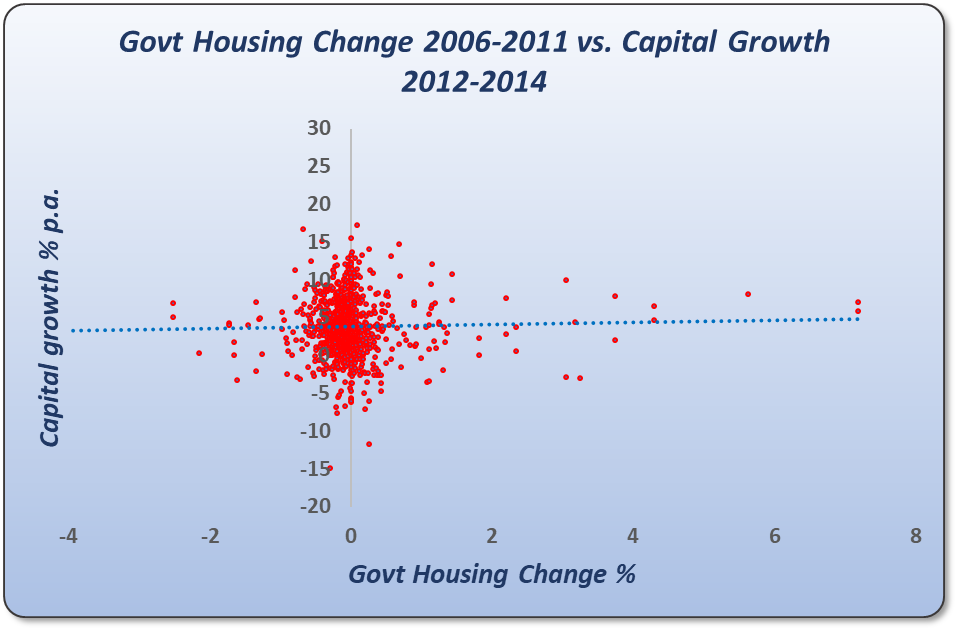
This chart shows the change in government housing from the 2006 census to the 2011 census. Note that a change can be negative – meaning there was a decrease in government housing.
The chart maps that change against the capital growth from 2012 to 2014. Remember we’re modelling a 1-year delay between the recording of the data and its publishing.
The trend line shows that there is no relationship. Again, it’s a flat line. This is what it looks like over 5 years of capital growth.
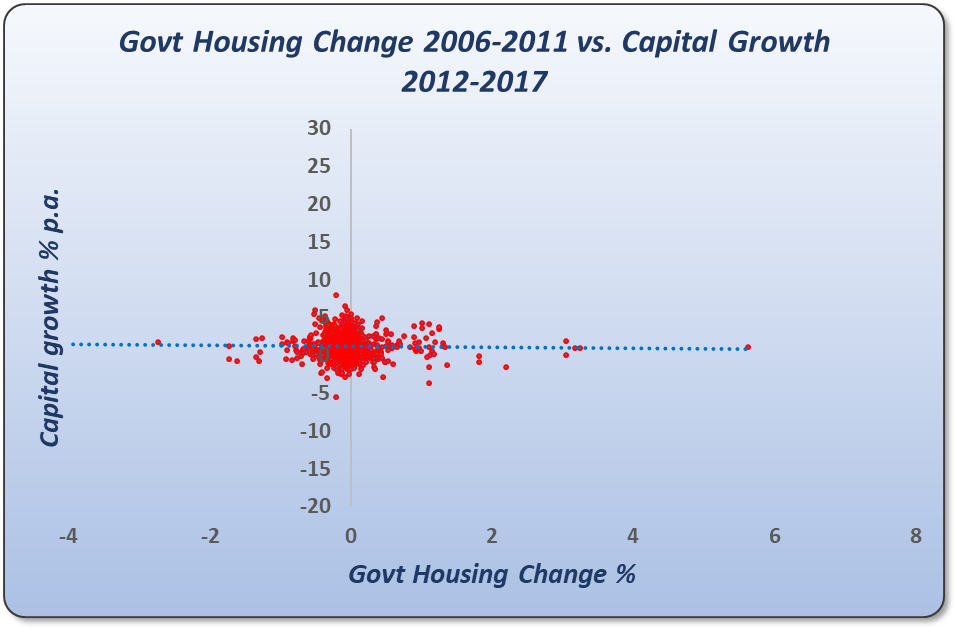
Again, there is no relationship.
10-year census gap
OK, perhaps the change over 5 years between censuses is not enough. Perhaps we should examine the change over a 10-year period instead. We can look at the change in government housing for each suburb from 2006 to 2016. And here’s what it looks like.
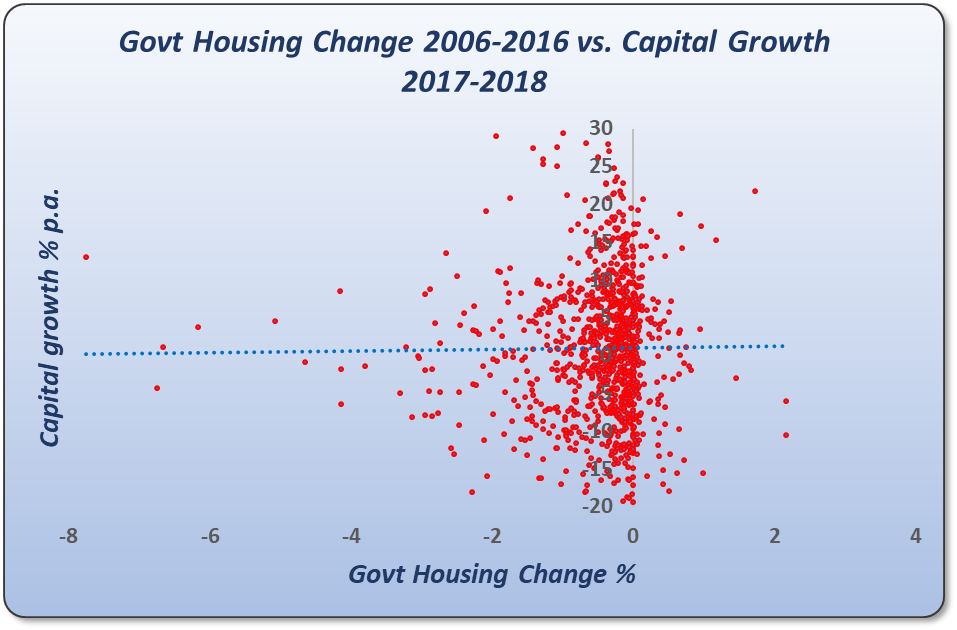
Again, you can see a flat trend line, meaning there is no relationship.
Why?
OK, so why isn’t there a relationship between government housing and future capital growth. Surely, lower socio-economic demographics should be a drain on price growth. I have a few theories:
- BAU
- Too few “housos”
- Affordability
Firstly, state housing authorities are not in the habit of shuffling their stock frequently. Most of the dwellings they own, they’ve owned for a long time. That means that if there are negatives brought about by social housing, those negatives have been around in the suburb for a long time already and have been well and truly factored into the prices. So, the growth moving forward is just business as usual (BAU).
This explains why a high concentration of “housos” might not affect capital growth at all. But what about changes to that percentage?
Well, secondly, the percentage of government housing in the vast majority of suburbs around Australia is a very small percentage. The average is around 3%. That’s simply not enough to radically alter the feel, mood or perception of the suburb to potential home buyers. The demographics of buyers would be far more influential.
Thirdly, in some cases, more affordable markets are actually dearly sort after, especially in cities where affordability might be a big issue for the average wage earner.
Anyway, these are just theories. It doesn’t really matter how sound a theory is if the data doesn’t support it.
Blocks vs suburbs
Now, before finishing up, I just want to address one more issue. The analysis I’ve conducted was at the suburb level. I could’ve shown you aggregated figures grouped to the post code level or local government area level. But it tells the same story. Accumulating it over larger geographies doesn’t change the relationship.
Similarly, drilling down to the street level doesn’t change the relationship either. If there is a relationship between government housing concentrations and capital growth, then it should appear at the suburb level. There’s nothing about streets and certain blocks that would obscure that relationship from view.
Conclusion
According to historical data, neither current levels of government housing, nor changes in levels from census to census, have been lead indicators of future capital growth.
....................................................................................
 Jeremy Sheppard is head of research at DSRdata.com.au.
DSR data can be found on the YIP Top suburbs page.
Click Here to read more Expert Advice articles by Jeremy Sheppard
Disclaimer: while due care is taken, the viewpoints expressed by contributors do not necessarily reflect the opinions of Your Investment Property.
