Canberra’s housing market currently has the third highest median house price in Australia and it rose by two per cent over the last three months. Unlike Melbourne and Sydney’s recent roller coaster housing markets however, Canberra’s rate of price growth has been far more regular, with a consistent rise in median house price of around six percent per year over the last decade.
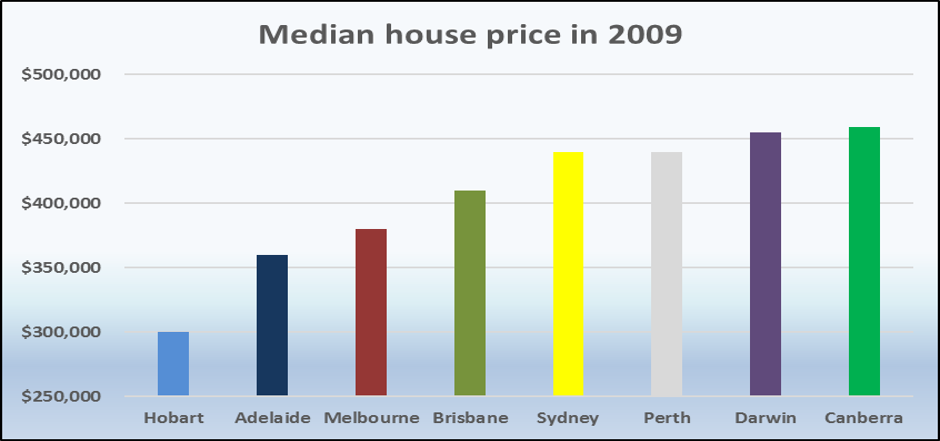
But, did you know that back in 2009 Canberra enjoyed the highest median house prices in Australia? This occurred during the fallout from the Global Financial Crisis, at a time when economic recession seemed imminent and many of our capital city housing markets went into decline.
The reason why Canberra is immune to economic downturns that hit housing markets in our other capital cities is because many of the city’s 30,000 businesses benefit directly from federal government procurement decisions and programs, which often increase during economic downturns.
This also applies to government administration, which produces nearly one third of the Australian Capital Territory’s economic output and accounts for over 40% of its workforce, so whenever the number of public servants in Canberra increases, housing demand grows as well.
Unfortunately, much of the accepted wisdom about the dynamics of Canberra’s property market is totally incorrect, and this makes its performance appear confusing and unpredictable. Many experts, for example, insist that Canberra’s housing market booms under Labor governments, because their big spending programs require more public servants.
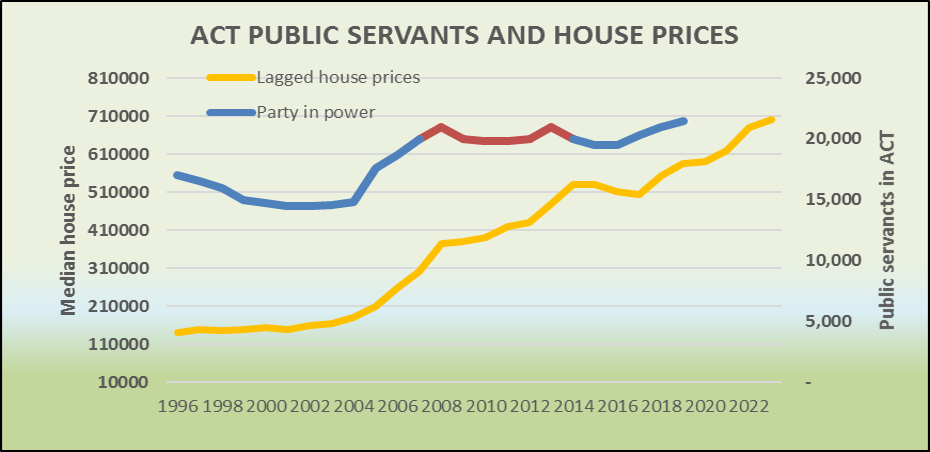
The data tells a different story, as the graph shows. Public service numbers in Canberra did not rise when the last Labor government was in power, (shown in red) and house prices actually fell from 2010 to 2013, during Labor’s last years in power.
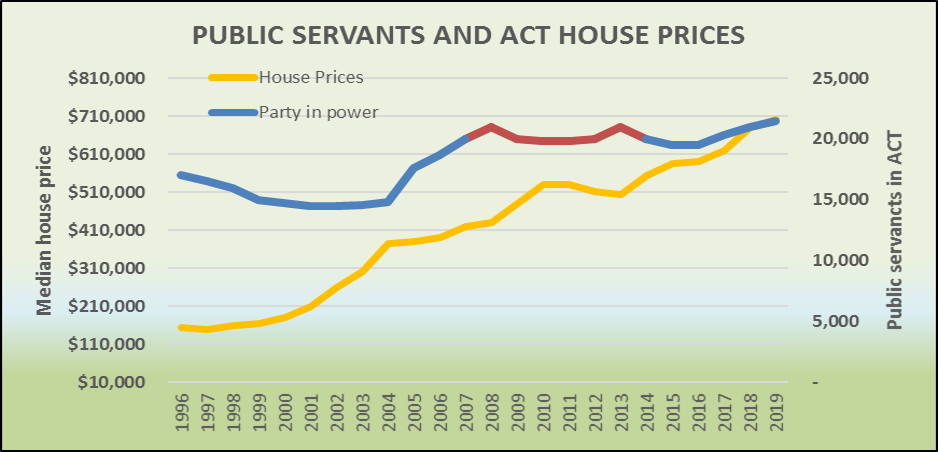
Yet we can observe a strong correlation between public service numbers and house prices in Canberra, if we ignore the smokescreens of accepted wisdom and look at the facts. These facts are that public service numbers are not dependent on which political party is in power but on two other criteria:
• The length of time that a government has been in power
• Whether their programs are administered from Canberra or via the States
For example, Canberra’s public service numbers rose dramatically during the last years of the Howard Coalition government with the introduction of WorkChoices. The Coalition government also entered into and then increased our military and peace keeping commitments in the Middle East, Pacific and East Timor. All of this called for a record number of public servants to be located in Canberra.
In 2007 the incoming Rudd Labor government dismantled WorkChoices, reduced our overseas engagements and embarked on a $42 billion “Nation Building” plan including the NBN rollout, new school halls, home insulation and transport infrastructure, which were administered by the State governments. State based public servant numbers rose, while the numbers in Canberra actually fell slightly.
Towards the end of the Rudd/Gillard government, public service numbers in Canberra started to rise again and more recently, after some initial cutbacks under the current Coalition government, the numbers of Canberra based public servants has steadily climbed once again. Why does this sequence of cuts and increases occur?
The reason is that each new government initially reduces public service numbers as they wind back or terminate programs developed by the previous government. However, the longer governments are in power, the more programs, schemes and initiatives they roll out, causing an increase in the numbers of public servants needed to administer them.
This occurs no matter which party holds government. What is important is the length of time a government has been in power and whether they administer any new programs centrally in Canberra or through the States. The graph shows you the number of public servants based in Canberra during the Coalition years (blue) and Labor years (red).
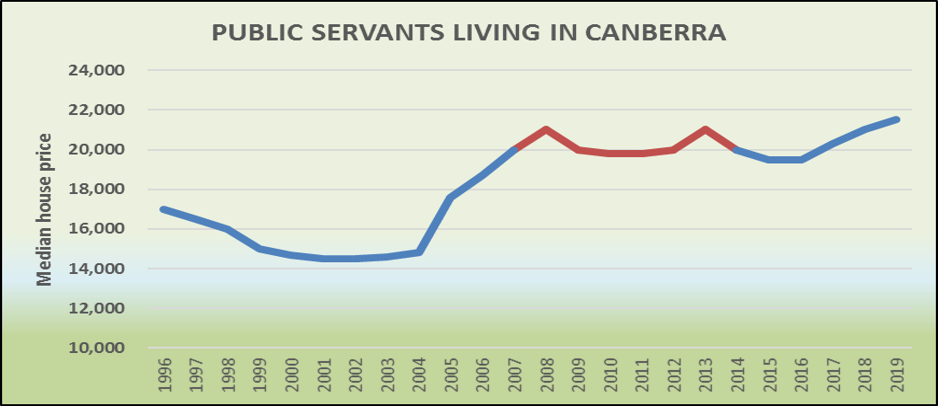
The graph indicates that the total is now at a record high and also that it is rising, so let’s look at how such increases in Canberra based public servants affects its housing market. Because most of the new public servants are on short term contracts, they may only initially intend to reside in the national capital for a few years, so they rent rather than buy.
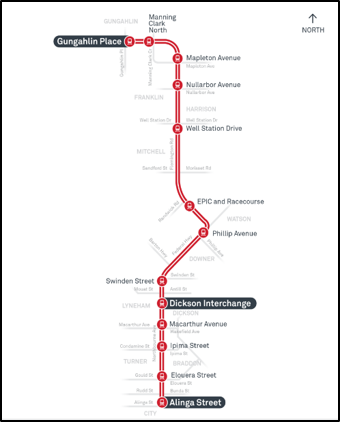 This means that the current increase in new residents is generating more rental demand, especially for low maintenance, well-appointed units. The recent completion of the Canberra Metro from Gungahlin to the city centre is now concentrating both the demand for and development of new high-density apartment blocks in suburbs along the light rail route as shown on the map.
While some of these new residents will leave at the end of their contracts, many others will stay and make Canberra their permanent home. They eventually move out of their unit rentals and become first home buyers in new outer suburbs.
This results in a time lag of around four years before the housing demand created by new public servants in Canberra transforms into home buyer demand, so any increase in Canberra based public service numbers therefore has two effects -
• An immediate rise in rental demand for inner urban units
• A delayed rise in buyer demand for outer suburban houses.
The four-year delay from arrival to purchase has such a strong correlation that it can easily be seen on this graph, which shows the total number of public servants located in Canberra each year compared to median house prices four years later.
Canberra is currently experiencing the second highest population growth rate of all our capital cities at 2.2% per annum, with many of the new arrivals working directly in the public service or employed in government programs and projects.
This high population growth rate is continually pushing up inner suburban unit rent demand, and by illustrating the delayed effect that increases in Canberra based public service numbers have on house prices, the graph also provides us with a useful house price prediction.
Canberra has the potential to experience strong and continued house price growth over the next few years, so if Australia does go into recession, Canberra may once again have the highest median house price of all our capital cities.
Sources:
CoreLogic published house price data
Residential Property Price Indexes, Eight Capital Cities, ABS 6416.0
Australian Public Service Commission Annual Reports
.................................................
 John Lindeman is widely respected as one of Australia's leading property market analysts, authors and commentators.
Visit Lindeman Reports for more information.
He has well over fifteen years’ experience researching the nature and dynamics of the housing market at major data analysts.
John’s monthly column on housing market research featured in Australian Property Investor Magazine for over five years. He is a regular contributor to Your Investment Property Magazine and other property investment publications and e-newsletters such as Kevin Turners Real Estate Talk, Michael Yardney’s Property Update and Alan Kohler’s Eureka Report.
John also authored the landmark books for property investors, Mastering the Australian Housing Market, and Unlocking the Property Market, both published by Wileys.
To read more articles by John Lindeman, click here
Disclaimer: while due care is taken, the viewpoints expressed by contributors do not necessarily reflect the opinions of Your Investment Property.

