‘Time in the market’ theory has been so effectively promoted that it seems to have become a rule, stating that housing prices have risen steadily in the past and will continue to do so in future. I believe that this theory is not only wrong, it is dangerous for investors.
Whenever housing market growth occurs, you’ll hear so called ‘experts’ claiming that it doesn’t matter where you invest because growth eventually evens out everywhere. Quoting the ‘time in the market’ theory, they’ll tell you that housing prices double every eight to ten years. They’ll say that this doubling in price is caused by an ongoing housing shortage which has seen house prices grow by an annual average of 8% or more since World War II.
Why is this theory so popular?
‘Time in the market’ investing makes property investment easy because eventually you will pick up the long term growth average. This is proven by the fact that over long periods of time, all areas of the housing market have grown at the same average percentage rate. In fact, the theory claims, you could throw a dart at a map of Australia, buy a property almost wherever it landed and achieve the same growth rate over a long enough period of time as the rest of Australia.
This theory also makes investing profitable, because the long term average annual house price growth rate since the end of WWII is widely recognised as being between around 8% or 9%. This means that property prices will double every eight to ten years.
Why is this theory completely wrong?
We can’t use past growth to forecast future growth, because the conditions that cause growth may be totally different in the future to what they have been. The years after WWII experienced some of the highest population growth and inflation rates in our history, neither of which are likely to occur again. That would be enough to sink the ‘time in market’ theory without trace, but there’s much more about this theory which makes it completely useless as a guide to the future.
House prices are closely aligned to the inflation rate
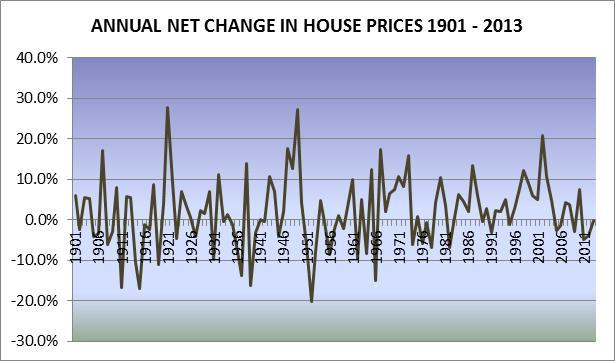
To produce information showing annual changes in housing prices and rents since 1901 we researched historical house price sales and rents using the NLA on-line Trove facility and the Mitchell Library’s Special Collections. Our findings (known as Lindeman’s Index) are corroborated by other similar studies of long term house price changes, such as the Herengracht Index in Holland and Stapledon’s Index in Australia. These studies all show that housing prices have risen consistently over long periods of time. In fact, since the end of World War II housing prices have grown at an average annual rate of 8.2%, leading to the myth that housing prices double every eight years. Over a longer time frame from 1901 to the present, the average rate of growth has been 5.8% per annum.
This is not ‘real’ growth because it includes the underlying inflation rate. Our inflation rate has averaged 3.8% annually since 1901 , and when this is deducted from the growth rate, it leaves housing growing at an average of just 2% per year. However, since the end of World War II the average annual inflation rate has been higher at 5.2%, and when we deduct this from the annual average housing growth rate of 8.2%, we are left with a real growth rate averaging 3% per year. The studies show that the main cause of house price growth has always been inflation and that the rate of house price changes has also closely followed the inflation rate.
Since the end of WWII the real rate of annual house price growth (when the underlying inflation rate is removed) has averaged 3.2% (Herengracht) and 3.1% (Stapledon). This is hardly the stuff of price bubbles, especially when we look at the cause of the real price growth.
Quality improvements in the same preferred locations
The cause of real house price growth lies in constantly improving features and the fact that most of us prefer to live in the same parts of the country. Since the earliest days of settlement there has been a continuous improvement in housing sizes, styles, facilities and features which adds to the cost of housing, and therefore the price. Stapledon calls this a ‘quality contribution’ and it contributes an average of around 1% per annum to housing prices. This can be expected to continue as the push for green housing with energy saving and utilising efficiencies gathers momentum.
At the same time, Australians have preferred to live in large cities and we have become increasingly urbanised, generating ever growing demand for housing in already heavily populated and over developed coastal areas. This adds to infrastructure development and maintenance costs as well as creating more or less continuous housing shortages in our cities. This is responsible for a ‘location levy’ causing the balance of growth in housing prices of an average of around 2% per annum.
Over time, the location levy has resulted in city house prices being higher than those in country towns, and this is unlikely to change in coming years, with no significant or serious decentralised housing initiatives forthcoming from governments at any level.
Where does this leave the ‘time in market’ theory?
Because inflation is the basic cause of housing price growth, we need only add the effects of continuous quality improvements, (the 1% quality contribution) and the growing costs associated with our wish to live in heavily urbanised areas (the 2% location levy) to the underlying inflation rate. All this tells us is the likely future overall growth rate over a long period of time in the entire housing market. It does nothing to identify those periods of time when little to no growth can be expected, or in which areas growth is likely to be greater than in others. This is important, as the graph shows that house prices jump around a great deal from year to year. Not only that, but the entire housing market does not operate as one entity. There are ten million dwellings in 15,000 residential suburbs and every one performs differently.
Price changes can occur fairly quickly within a few months, and they can vary substantially from one location to another. Rather than being a cause for concern, this is actually one of the greatest benefits of investing in housing, because we can borrow most of the purchase price and leverage the growth which occurs on the entire price of the property, not just our small percentage of it. Not only can you do much better than achieving the long term growth rate, but being able to use borrowed money to do this is a unique feature of housing investment. The trick is to know where to buy and when to sell, which means understanding ‘timing in the market.’
1. Eichholtz P. M. A, A Long Run House Price Index: The Herengracht Index 1628 – 1973, Real Estate Economics, 1997
2. Stapledon, Nigel, Long Term Housing Prices in Australia and some Economic Perspectives, PhD Thesis, Uni NSW
3. Retail CPI A Series, B Series, C Series, D Series, IRPI and CPI data, Australian Bureau of Statistics
.................................................
 John Lindeman is widely respected as one of Australia's leading property market analysts, authors and commentators.
Visit Lindeman Reports for more information.
He has well over fifteen years’ experience researching the nature and dynamics of the housing market at major data analysts.
John’s monthly column on housing market research featured in Australian Property Investor Magazine for over five years. He is a regular contributor to Your Investment Property Magazine and other property investment publications and e-newsletters such as Kevin Turners Real Estate Talk, Michael Yardney’s Property Update and Alan Kohler’s Eureka Report.
John also authored the landmark books for property investors, Mastering the Australian Housing Market, and Unlocking the Property Market, both published by Wileys.
To read more articles by John Lindeman, click here
Disclaimer: while due care is taken, the viewpoints expressed by contributors do not necessarily reflect the opinions of Your Investment Property.

