15/03/2018
Many real estate agents swear that spring is the best time to sell. They assure vendors that more buyers venture out once winter is over, and fewer people go house hunting in summer as they’re in holiday mode. But is that really the case?
The above logic also makes summer the best time to buy, because there is apparently less competition from other buyers.
It all seems to make perfect sense, but are these notions and beliefs supported by the facts?
Certainly, academic studies done by the London School of Economics show that housing markets in the UK have higher sales and prices in the warmer months and fewer transactions and lower prices in winter. Yet is it relevant to rely on UK studies when our climates across Australia are so very different?
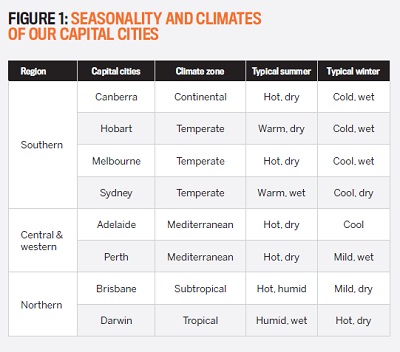
As Figure 1 shows, Australia’s capital cities are situated in a variety of climate zones, ranging from tropical to temperate, and in some northern cities winter is a far more agreeable time of year to conduct on-the-ground housing research, while summers can be uncomfortably humid.
Even in some southern cities winters can be mild and pleasant enough to venture outside on
a new house search. It is highly unlikely that the Australian climate itself could make a substantial enough difference to support the common wisdom that buying a property is a warm-weather affair.
To test these perceptions and decide whether or not seasonality exists as far as the housing market is concerned, we need to look for any regular changes that occur in both sales and listings over time and see whether these then result in price changes. We also need to do this for both houses and units and in different climate zones, to see if any regular patterns emerge.
Property sales and the seasons
The number of sales is a reflection of buyer activity, so if seasonality is caused by changes in buyer demand, the number of house or unit sales will reveal any trends over time. To identify and isolate any possible seasonal effect we need to divide sales by different types of markets, which I have done by grouping the Australian housing market into three climatic regions – the southern capital cities of Sydney, Melbourne, Canberra and Hobart; the northern cities of Brisbane and Darwin; and the central and western capital cities of Adelaide and Perth.
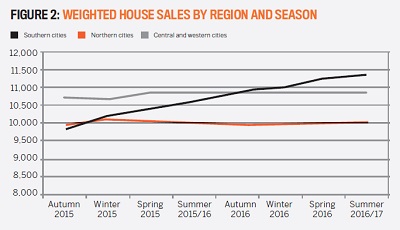
Naturally, cities in other housing markets can then be included in one of these three groups, according to their location. Figure 2 (overleaf) shows the house sales for each season and each group of cities from autumn 2015 to the 2016/17 summer.
The results in Figure 2 provide no evidence of any seasonal variation in house sales over time. The number of sales in the southern capital cities
of Melbourne and Sydney, in particular, have been rising steadily. In the other capital cities sales have been steady, with only slight variations over time. These results do not provide evidence of seasonality.
Figure 3 indicates the total unit sales that occurred during each season. These figures show the steady rise in unit sales that has taken place in Sydney and Melbourne up to the middle of 2016, with a slowdown in sales occurring in the autumn of 2016, followed by an actual reduction in sales volumes since then. While this marks a distinct period of change in demand patterns, it does not indicate any seasonal variation. Further, there is no evidence of seasonal sales variations in any of the regional markets at all.
Taken together, the two sales graphs show that there is no evidence of any seasonality in demand for either houses or units but merely that demand rises or falls in response to other dynamics. This is largely due to the fact that the way we look for and buy property has changed with the arrival of online listing sites. Virtually all potential buyers no longer do their initial research by travelling from one real estate agent to the next or doing physical inspections but spend their free time researching on online listing sites or apps instead.
"Potential buyers no longer do their initial research by travelling from one real estate agent to the next or doing physical inspections"
They can do this anytime and anywhere, from the comfort of their homes, at work or while on holiday, and they can ask for more information by email or phone. As far as residential property-buying goes, the internet has been a game changer and is the main reason sales are no longer seasonal in the way they may have been many years ago.
Buying a house or unit is also a process that can take months, from initial offer to exchange
of contract and settlement.
 A family buying a new home before they go on holiday in summer can either hasten or delay this process to meet their needs, while for other buyers, such as overseas investors, the time of year is irrelevant. In short, there is no overall change in demand patterns that is seasonal, but looking at sales only gives us half of the picture – we need to assess any changes in listings or properties for sale on the market as well.
Property listings and the seasons
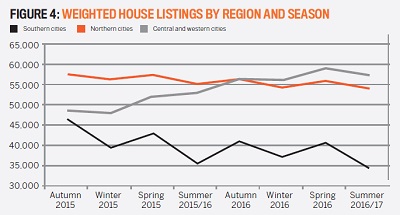
With no overall seasonal change affecting sales, the balance of supply and demand can only be influenced by the supply side – or the number of listings. Figure 4 shows the average number of daily house listings that occurred during each season for each of the three housing market regions we have analysed.
The graph shows that listings do indeed vary by season, and that the differences occur 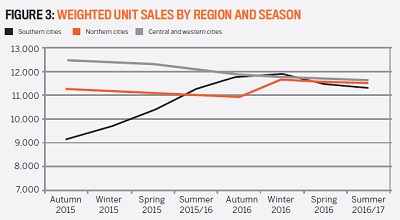 in each region. Listings are at their lowest in winter and again in summer, with a clear rise in listings from each winter to spring and again from summer to autumn. These seasonal variations don’t hide the overall trends that have been taking place, such as the gradual rise in the number of houses listed for sale in Adelaide and Perth or the fall in houses on the market in Sydney and other southern cities.
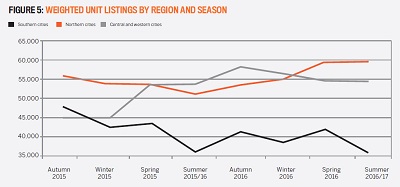
Figure 5 (overleaf) gives us the same data for units, showing that there is also a clear seasonal change in the number of units listed for sale in each region, with the listings being lowest in winter and in summer. These variations are more pronounced in the southern cities of Sydney and Melbourne but still don’t hide the overall downward trend in listings that has taken place.
Why do fewer potential vendors put their properties on the market in summer and winter than at other times of the year? The reason is the perception that there will be fewer buyers out there during the summer holidays and colder winter months, and therefore less competition.
Although we now know from the above research that this is not so, it prompts some vendors to not put their properties on the market during winter or summer. This has the reverse effect of what they intend because it means there are fewer properties for sale at those times of year, while the number of potential buyers does not change significantly from one season to the next. Seasonality therefore has a completely different effect on housing prices to what the myth would have us believe.
How property prices vary with the seasons
Because we know there are no seasonal changes to the number of property sales, we can measure any effect the seasonal variation in listings has on the housing market by the changes to the median price for houses and units in each region.
In other words, a fall in the number of listings should cause higher prices and a rise in listings should lead to lower prices, or at the very least have a dampening effect on price rises. Let’s now look at the changes to median prices that took place in the three regions over the same time to see whether any seasonal changes are apparent. Figure 6 shows the median price change for houses in the capital cities represented by each of the three climatic regions.
"Why do fewer vendors put their properties on the market in summer and winter than at other times of the year?"
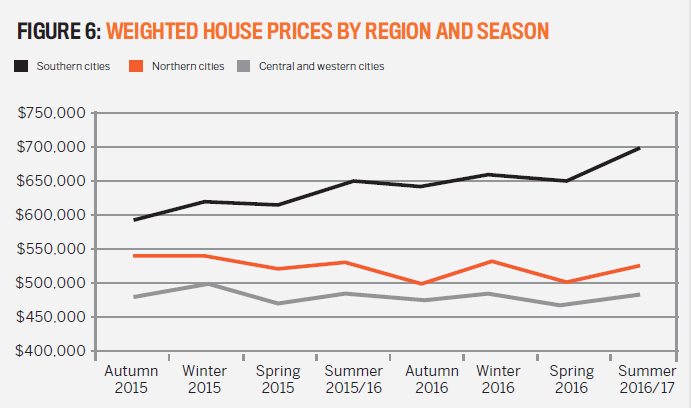 Rather than the straight growth and decline curves we saw in the sales figures, Figure 6 shows there is a noticeable seasonal variation taking place in our house markets. Price growth slows in spring and autumn, even causing occasional small falls in the median house price. Then there is a definite pick-up in price growth that occurs during the winter months and again in summer. Figure 7 shows the same regional and seasonal data for units.
The seasonal variation in median unit prices is quite evident in Figure 7, with the higher unit listings causing a market slowdown, even falling prices, in the spring and autumn seasons. Actual, although temporary, prices falls are evident in every capital city market during this time, followed by strong price growth in the next winter and summer seasons. Even when prices are trending upwards over the entire study period in the southern cities of Sydney and Melbourne, the seasonal spring and autumn price 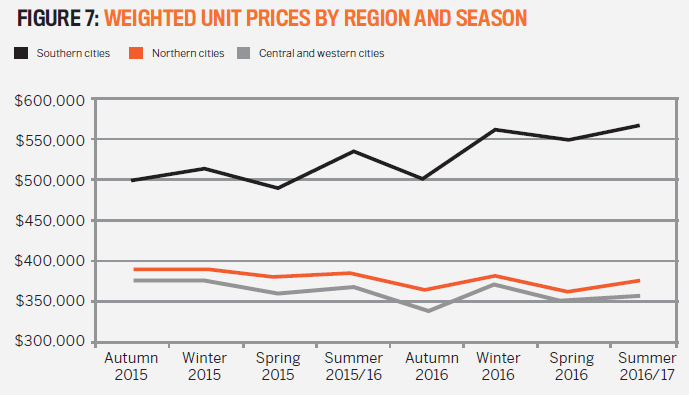 dip is clear.
Solution to the seasonal dilemma
With this data at our disposal, we can now put the seasonality myth to rest and put the facts to good use in choosing the best time to buy or sell.
"The change in median price from one season to the next can be as much as 5–10%"
Even though the total number of sales does not change with the seasons, there tend to be fewer properties on the market during winter and summer than there are during spring and autumn.
However, because the number of buyers does not change, there is more pressure on prices as potential purchasers compete for the smaller number of properties on the market. As a result, prices tend to rise in summer and winter when listings are at their lowest and fall in spring and autumn when more vendors are trying to sell.
The change in median price from one season to the next can be as much as 5–10%, which easily outweighs the trend changes that are taking place
in the overall market. So, if you have a choice it pays to use seasonality to your advantage. Spring is the best season to buy a house or unit, as the number of properties on the market is higher and median prices are lower, while summer is the best time to sell, because the number of properties for sale is lower and median prices are higher.
 John Lindeman
is director of Lindeman Reports,
and author of Unlocking the
Property Market
