Property market sentiment has changed over the last month, buoyed by the results of the Federal election, falling interest rates and APRA loosening its restrictions on lending however, there was still a decline in property values in our national housing markets in the month of May.
National dwelling values fell for the 19th consecutive month in May 2019, recording a -0.4% decline – the smallest monthly decline since August 2018.
Corelogic reports that over the month, combined capital city values fell by -0.4% while the combined regional markets recorded a -0.2% fall.
Over the past year, national dwelling values have fallen by -7.3% which is their largest annual fall since January 2009.
Combined capital city dwelling values were -8.4% lower over the year and combined regional market values were -3.0% lower.
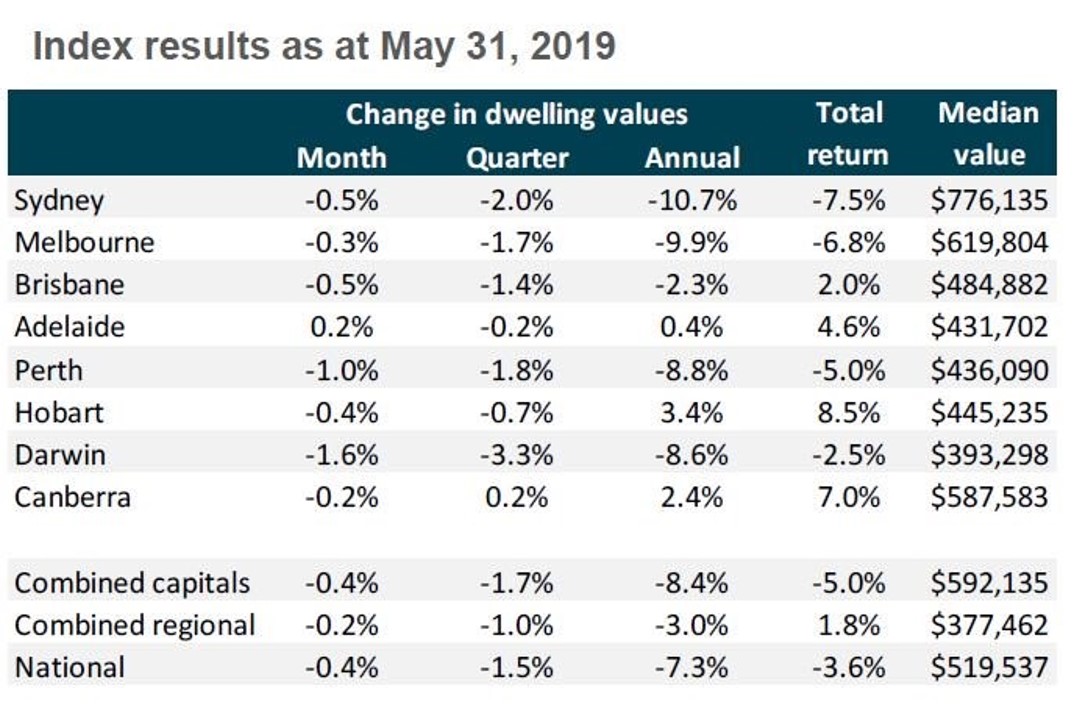
Over the past year, values have fallen in all capital cities except for Adelaide, Hobart and Canberra however, each capital city has a lower rate of annual value change over the past year compared to the previous year.
.JPG)
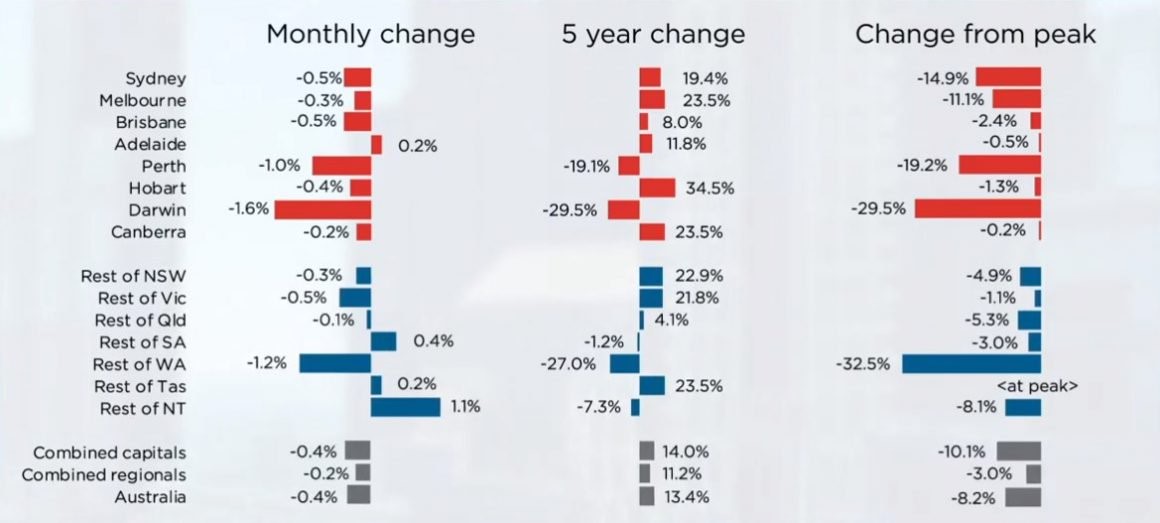
The Australian housing market remains in a geographically broadly-based downturn.
Monthly price declines are now moderating, suggesting that we are probably past the worst and prices should begin to stabilise by late 2019.
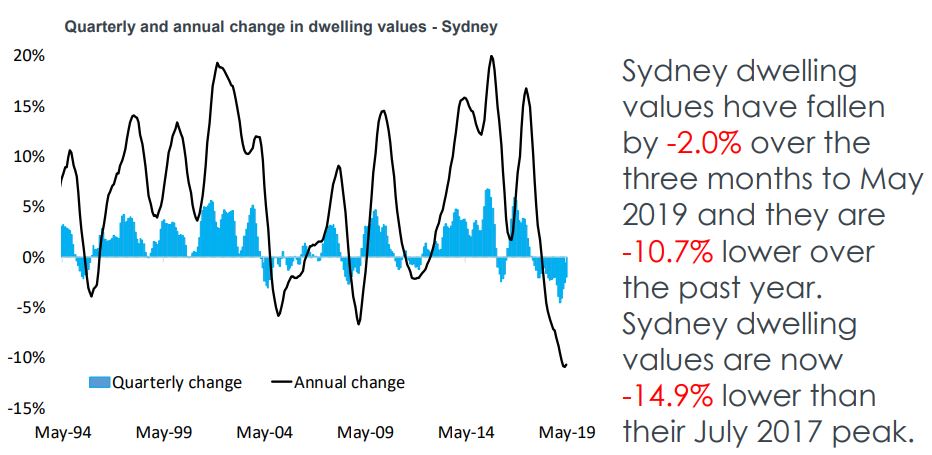
Sydney dwelling values continued to trend lower in May, down a further 0.5% over the month and are now down 14.9% from their market peak in July 2017.
The good news is that this was the smallest month on month decline since March last year.
Auction clearance rates in Sydney have been rising into the high 60% range, albeit on lower volumes.
An interesting change in trend is that apartment values (-2.3% over the last 3 months) are currently falling faster than home values in Sydney (-1.9% over the last three months).
Currently there is a significant number of new apartments coming onto the market in Sydney- it is estimated that 54,000 apartments will be completed in Sydney in 2018 and 2019 – and this will obviously put pressure on prices and rentals.
Sydney homes now an average of 50 days to sell, compared to 33 days a year ago, however vendors are discounting their properties by an average of 6.7% compared to 5.3% a year ago to affect a sale.
Over the previous 12 months 20.2% fewer properties sold in Sydney than in the previous year.
The fact that Days on Market and Vendor Discounting are dropping and auction clearance rates are rising are all positive signs.
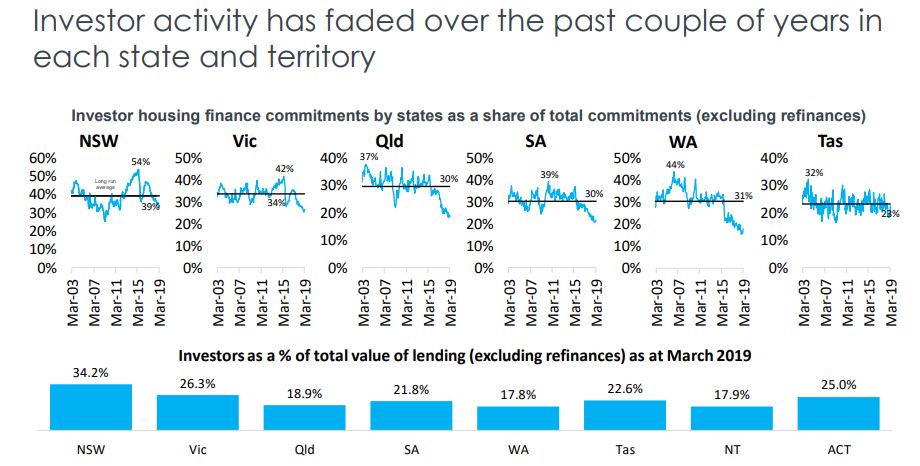
So is the fact that first home buyers’ interest is increasing with 25% of home loans approved in NSW in March going to first-time buyers.
It is a great countercyclical time to look at buying an investment grade property in Sydney.
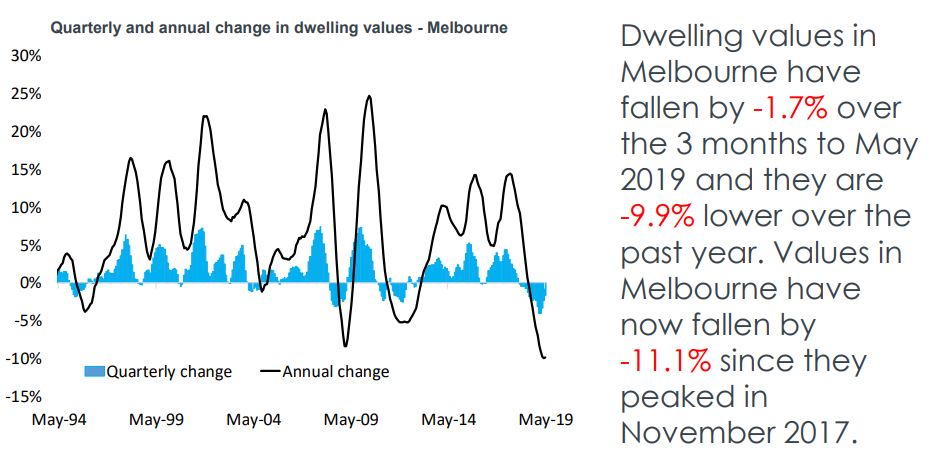
Melbourne dwelling values continued to trend lower in May, down 0.3% over the month to be 11.1% lower since peaking in November 2017, but according to Corelogic Melbourne dwelling values remain 25% higher than they were five years ago.
Although values are still falling, this was the smallest month on month decline since March last year and continues a trend of diminishing declines that have been evident since February earlier this year.
Over the last year there were 25% fewer sales than the previous year, a sign that sellers are not putting their properties on the market unless they really need to sell.
Melbourne homes now an average of 44 days to sell over the March quarter, compared to 29 days a year ago, however vendors are discounting their properties by an average of 6.3% compared to 4.0 would% a year ago to affect a sale.
Over the last 12 months 27.4% fewer property sold in Melbourne than in the previous year.
The resilience across the apartment sector, despite higher supply levels, probably comes back to a combination of affordability constraints in the market as well as more first home buyers supporting housing demand across the lower price points of the market, thanks to the First Home Owner incentives.
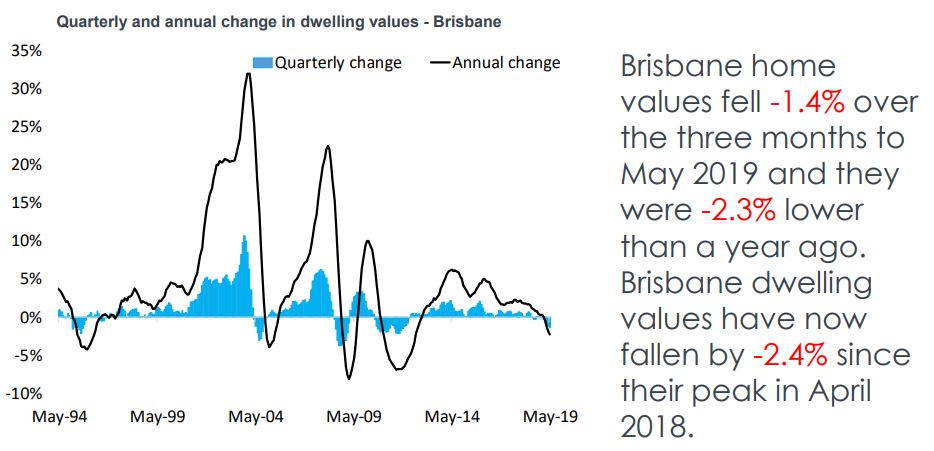
Brisbane property values were down 0.5% in May, with falls confined to the detached housing sector.
Corelogic report that apartment values actually rose 0.1% over the month, breaking a long-running trend of falling values.
While Brisbane apartment values remain 12.5% below their 2010 peak, the unit oversupply has slowly been absorbed due to rising population at a time of less new supply coming on to the market.
The slower Brisbane housing market means that:
• The average selling time of a home is 55 days (36 days a year ago) and
• Vendors are discounting their properties an average of 5% to affect a sale (4.3% a year ago)
• 12.7% fewer properties sold in the last 12 months compared to the previous year
With migration rates lifting, supply under control and generally healthy levels of housing affordability, the Brisbane housing market fundamentals are looking healthier compared to most other capital cities.
At the same time the underlying strong demand from home buyers and investors from the southern States at a time when yields are attractive and housing affordability is relatively healthy and putting a floor under property prices.
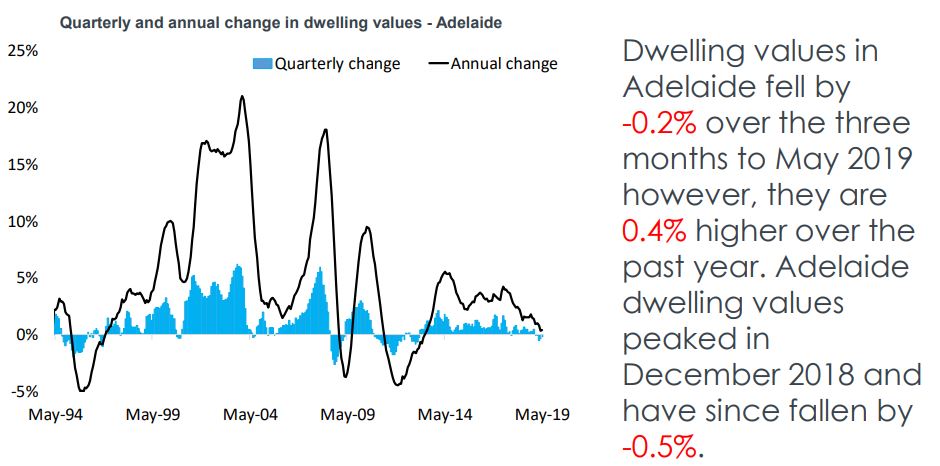
Adelaide was the only capital city to avoid a fall in housing values through May, with the CoreLogic index rising 0.2% over the month to be 0.4% higher over the past twelve months.
Adelaide is the most affordable capital city in Australia with dwelling values falling -0.2% over the last 3 months but they are up 0.4% over the last year.
Signs of the slower Adelaide property market include:
• The average selling time for a home is 43 days – much the same as last year (42 days a year ago) and
• Vendors are discounting their properties an average of 5.3% to affect a sale (4.9% a year ago)
• 2.3% fewer properties sold in the last 12 months compared to the previous year
While things look good for Adelaide property in the short term, over the next few decades the bulk of Australia’s long-term jobs growth, economic growth and population growth will occur in our 4 big capital cities meaning there are better locations for long term wealth creation that Adelaide.
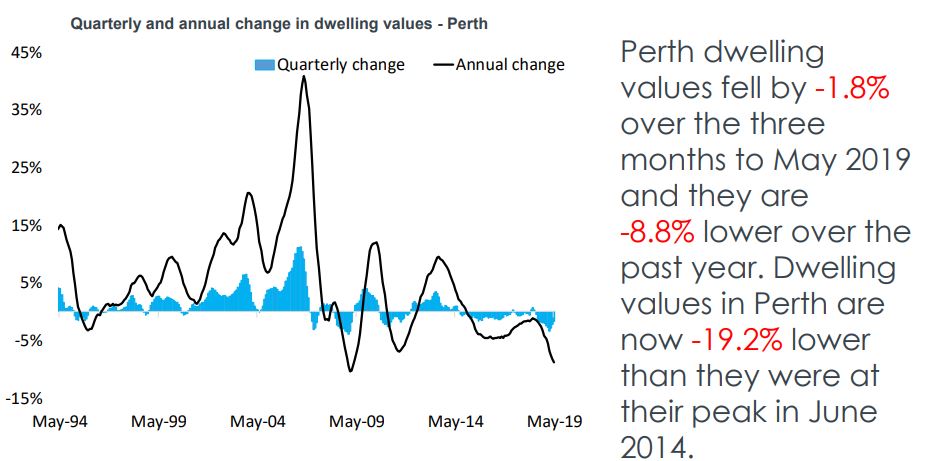
Perth has recorded a further reduction in dwelling values, down 1% over the month and 8.8% lower over the past twelve months taking values 19.2% lower since peaking in June 2014.
The ongoing weakness in the Western Australian housing market can be attributed to mix of weak economic and demographic conditions overlaid with a tight credit environment.
Perth values are now amongst the most affordable amongst the capital cities with a median dwelling value of $436, 000 which is only $4,500 higher than Adelaide’s median dwelling value.
Signs of the slow Perth housing market include:
• The average selling time of a home is 57 days (49 days a year ago) and
• Vendors are discounting their properties an average of 6.9% to affect a sale (6% a year ago)
• 7.2% fewer properties sold in the last 12 months compared to the previous year
It’s much too early for a countercyclical investment in the west – I can’t see prices rising significantly for a number of years.
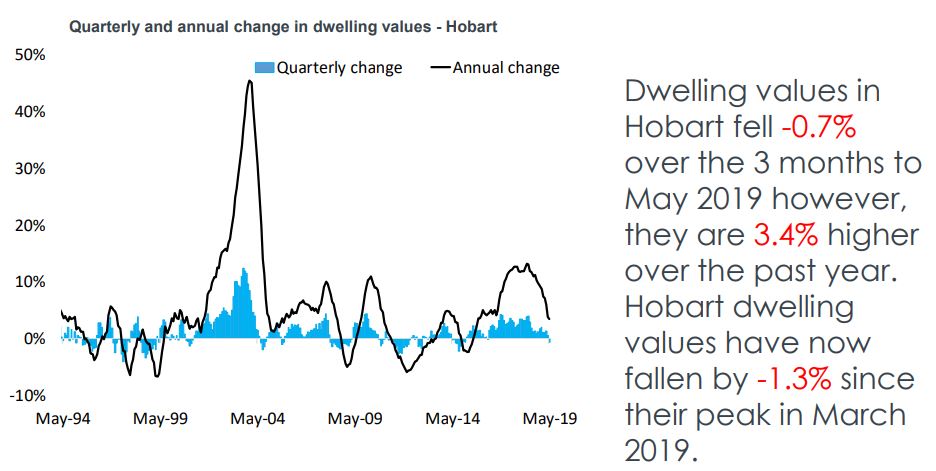
Hobart has been the best performing property market in the last three years, but it looks like the boom is now over with prices peaking in March this year.
CoreLogic figures showing a 0.4% slide of dwelling prices last month.
Further signs of the slowing Hobart property market include:
• The average selling time for a home is 32 days (9 days a year ago) and 4.33.3
• Vendors are discounting their properties an average of 4.3% to affect a sale (3.3% a year ago)
• 10.1% fewer properties sold in the last 12 months compared to the previous year
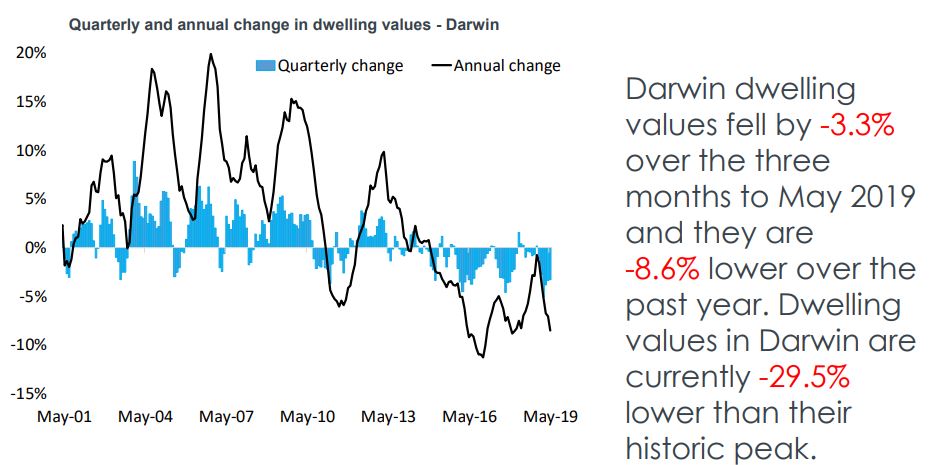
The Darwin property market peaked in August 2010 is still suffering from the effects of the end of our mining boom with a very soft employment market and lack of migration and infrastructure spending.
Currently values are 29.5% below their historic averages and it is unlikely we’ll see these types of house prices again in the next decade.
The small size of the Darwin market makes it more susceptible to local events and Darwin typically has a higher and more variable vacancy rate, a product of a large transient working population.
Darwin does not have significant growth drivers on the horizon and would be best avoided by investors.
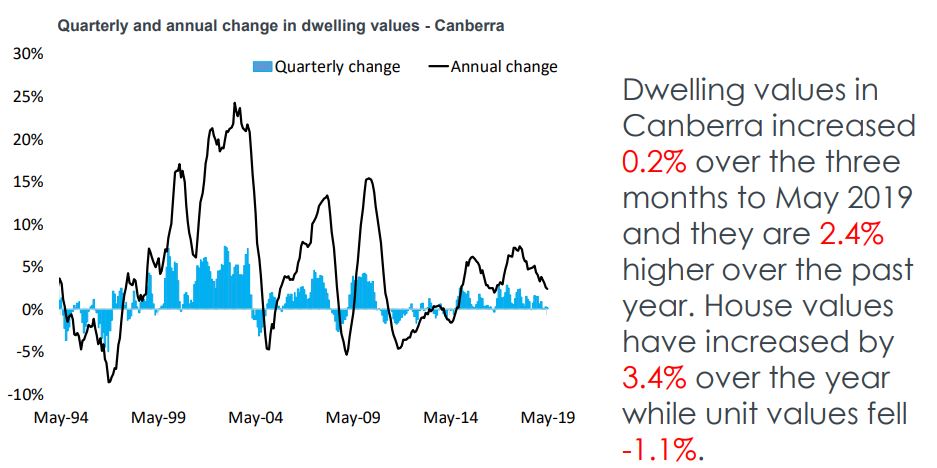
Canberra’s property market is a “quiet achiever” with dwelling values having grown 2.4% over the last year with house price growth (+3.4%) much stronger than the apartment market where prices fell – 1.1% over the last 12 months.
With the Federal election now over, confidence is likely to return to the Darwin market and population growth is expected to remain strong, which will support underlying demand for dwellings.
Our property markets are still easing
Vendor metrics have generally improved over recent months but are weaker than a year ago.
Corelogic report the number of property transactions is down 16.6% nationally year on year, Darwin was the only city in which sales volumes rose over the year.
.JPG)
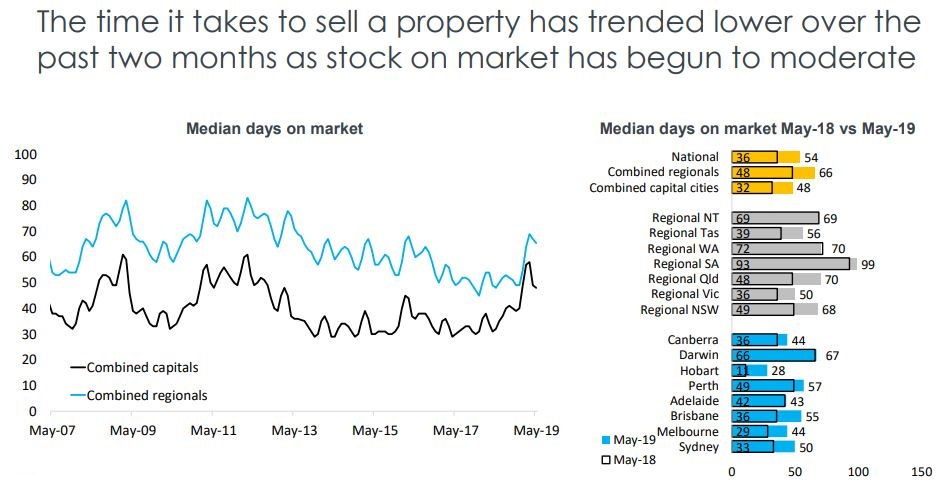
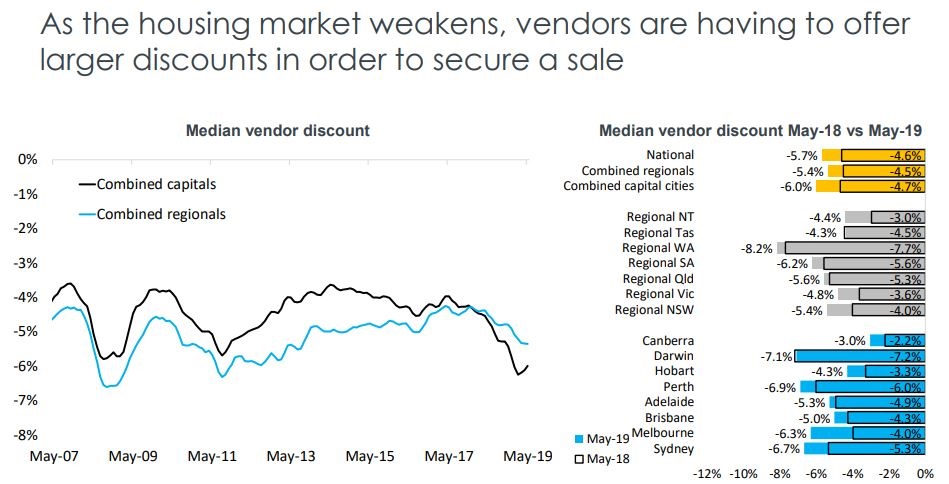
Other signs of our slowing property markets are rising Days on Market (the time it takes to sell a property) which is a sign that there more properties available for sale then there are active buyers, and also the increase vendor discounts necessary to sell a property.
Vendors seem to have got the message that it isn’t a great time to sell, with fewer new listings being added to the market than over recent years, while total advertised stock levels are tracking much higher, due to a slower rate of absorption.
.JPG)
One sign of increased confidence, especially in the Melbourne and Sydney property markets arising auction clearance rates.
If these continue to remain in the high 60% range this could lead to rising property values.
![]()
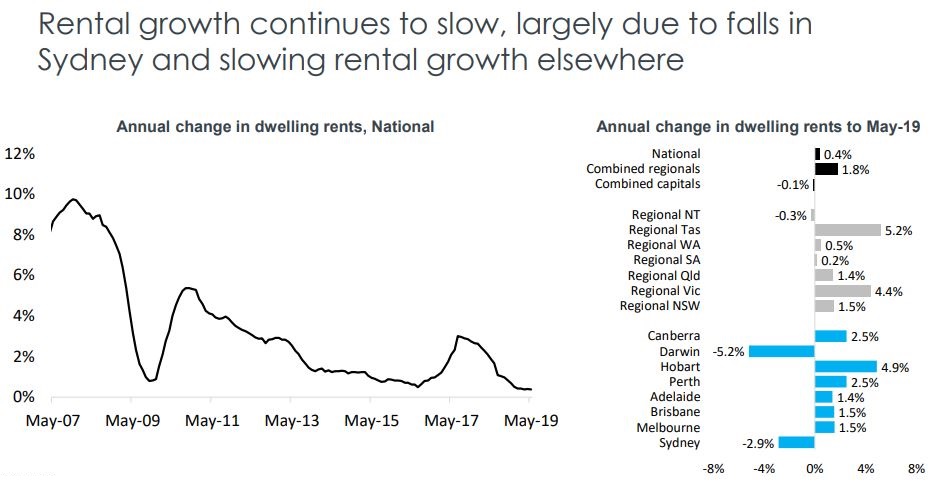
Our rental markets are also doing it tough
Rental markets continue to trend lower.
Corleogic reports that national rents were unchanged over the month and 0.4% higher over the past year which remains their slowest annual rate of growth on record (data from 2005).
Other market indicators:
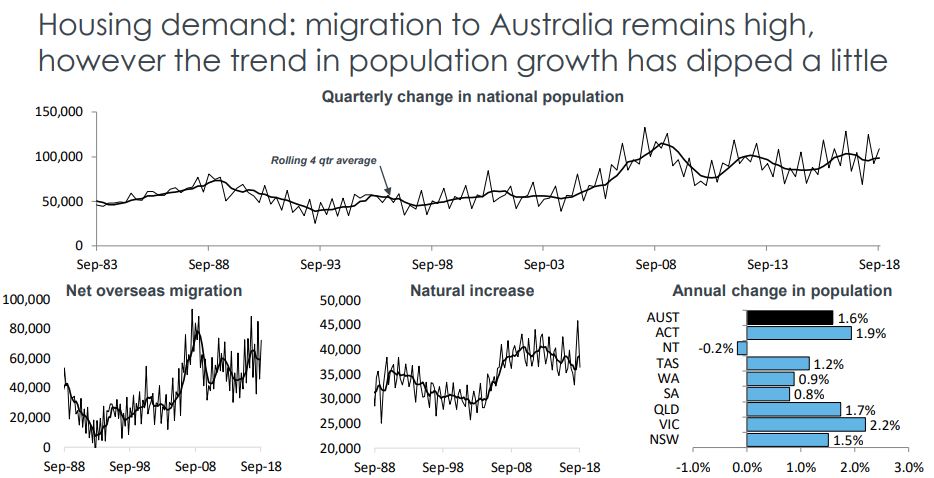
The trend in population growth has eased over the twelve months ending March 2018, as both the rate of net overseas migration and the rate of natural increase fell. Slower population growth has a negative implication for housing demand.
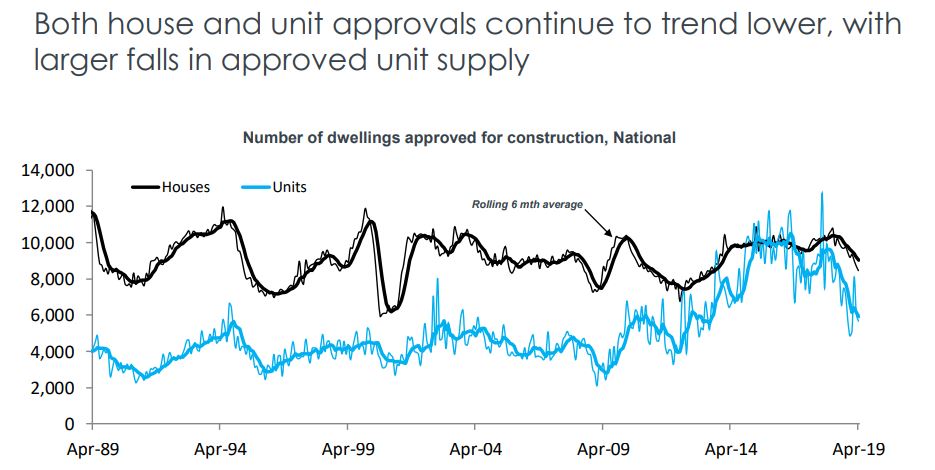
Dwelling approvals are trending lower and expected to fall further, despite a slight increase over the month.
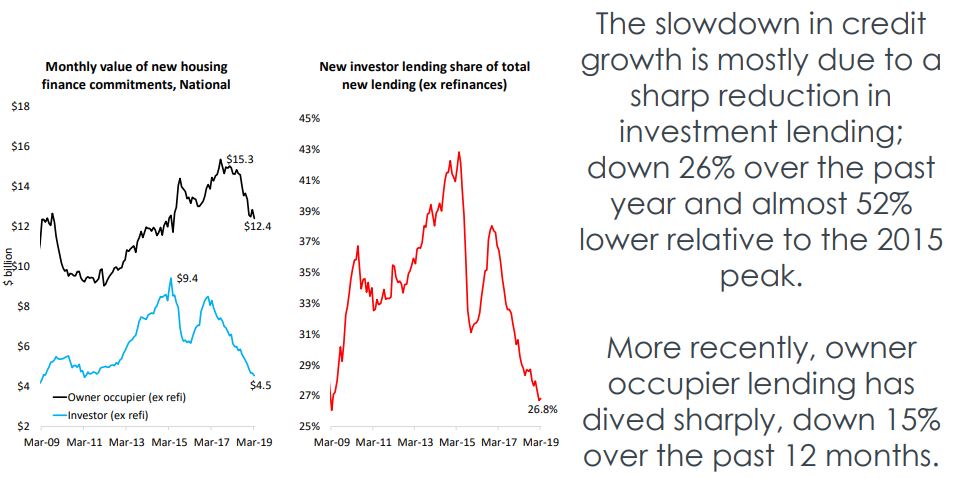
• Housing finance data and credit aggregates highlight the slowdown in investment lending, while owner occupier lending has slowed but has risen by 5.5% over the 12 months to April 2019 while investor credit has increased at an historically slow rate of 0.6%.
• Official interest rates were cut to 1.25% in June and the expectation from the market is that cuts are more likely than increases from here
THE BOTTOM LINE…
We’re at an interesting stage of our property cycle with signs we’re nearing the bottom.
While there may be a little more downside in our big two capital city markets it looks like the best time to buy countercyclically in Sydney and Melbourne for over a decade and to ride the Brisbane property cycle.
Canberra property should continue to perform well, and Adelaide should hold its own, but it’s likely Hobart will now slowly move to the slump phase of its own property cycle and there is still more downside for Perth and Darwin.
Of course, property will remain a sound asset for long term wealth creation, but now more than ever correct asset selection will be critical, so only buy in areas where there are multiple long-term growth drivers such as employment growth, population growth or major infrastructure changes.
Similarly, suburbs undergoing gentrification are likely to outperform.
Michael Yardney is a director of Metropole Property Strategists, which creates wealth for its clients through independent, unbiased property advice and advocacy. He is a best-selling author, one of Australia’s leading experts in wealth creation through property and writes the Property Update blog.
