Housing affordability across Australia has shown slight signs of improvement at the height of the COVID-19 pandemic, the latest data from the Real Estate Institute of Australia (REIA) has revealed.
During the past quarter, rental affordability reached its highest level in more than a decade, with the proportion of income needed to meet lease payments dropping by 0.4 percentage points to 23.3%, which is 0.5 percentage points lower compared to last year.
“Rental affordability has not been this high since December 2007, a positive for renters in these COVID-19 times,” said REIA president Adrian Kelly. “This can be mainly attributed to the reduction or stabilisation of rents during the June quarter, with only the Australian Capital Territory having an increase in rents.”
Kelly also said that while family income barely rose during the second quarter at 0.1 percentage point, record-low interests rates meant loan repayments also dropped. “The average loan repayment decreased 0.6 percentage points through a drop in the average variable standard interest rate,” he said.
On average, Australians spent more than a third or 34.5% of their weekly family income on loan repayments in April, May, and June. The national median weekly family income during the period was $1,819, according to the report.
However, the proportion of family income needed to meet loan repayments varies depending on the state. REIA’s infographic below shows how much of a family’s weekly income is allocated for loan repayments in each state.
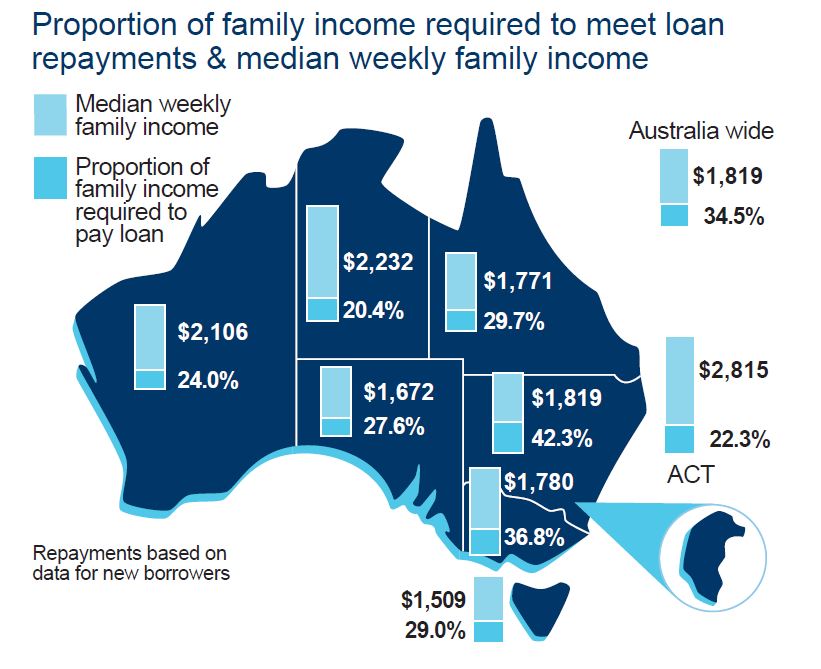
New South Wales residents allocate the greatest proportion of their pay to loan repayments at 42.3%, while those living in the Northern Territory spend the least at 20.4%. In terms of income, residents of the nation’s capital have the highest weekly average at $2,815, with 22.3% going to loan repayments.
Housing affordability: State-by-state breakdown
REIA’s report reveals a small improvement in housing affordability across the country during the months when the coronavirus crisis was at its peak. Here’s how each state fared:
New South Wales
While the proportion of income required to meet loan repayments in NSW decreased by 0.2 percentage points from the first quarter of the year to 42.3%, the number is still 7.8 percentage points higher than the national average, making the state the least affordable place to buy a home. The number is also a 2.4-percentage-point jump year-on-year.
Despite this, the number of housing loans in NSW increased to 20,951, up 4.2% from the previous quarter and 1.2% from last year. First home buyers accounted for 6,801 of the total, a 2.7% jump from the first three months of 2020 and a 16% jump year-on-year. FHBs from the state constitute slightly more than a quarter of the country’s total.
Average loan size also increased to $605,050, rising of 1.6% over the quarter and 17% from 2019. NSW has the largest average loan size in Australia, which is 22.7% higher than the national average.
As for rent, the proportion of income needed to pay remained at 27.5%, the same as the first quarter but a 0.5-percentage-point drop from last year.
Victoria
The proportion of family income devoted to meeting average loan repayments in Victoria decreased to 36.8%, down 0.7 percentage points over the quarter but up of 2 percentage points from the previous year. The figure is also slightly higher than the national average of 34.5%.
Second quarter numbers for overall housing loans climbed 0.8% from the first quarter to 21,571, the highest in the country, but down 4.1% year-on-year. Of these, 9,119 are first home buyers accounting for 33.8% of the Australia’s total. The state’s average loan size was $515,567, 4.5% higher than the national average.
Rental affordability in Victoria also improved during the June quarter with the proportion of income required to meet median rent falling to 22.5%, a decrease of 0.5 percentage points both from the previous quarter and the same period last year.
Queensland
Homeowners in Queensland spent 29.7% of their income on mortgage repayments from April to June, sliding 0.7 percentage points from the first quarter and 0.8 percentage points from last year. The figure is 4.8 percentage points below the national average.
However, the number of loans also went down to 14,342, a 9.9% drop from the previous quarter and a 5.4 decline year-on-year. First home buyers make up 4,888 of the state’s total, which was 18.1% of the country’s overall numbers.
Queensland’s average loan size from the second quarter increased to $414,426, a 0.1% uptick from the previous quarter and a 7.6% rise year-on-year. The amount was 16% lower than the national average.
Rental affordability also improved in the state with the proportion of family income required to meet median rent decreasing to 21.5%.
South Australia
South Australian homeowners experienced a drop in the proportion of income required to meet April to June mortgage repayments, which was down 0.3 percentage points both from the previous quarter and year to 27.6%.
But the number of dwelling loans also decreased by 1.3% to 5,688 in the second quarter, 1,562 of which were first home buyers. FHBs from the state accounted for about 6% of Australia’s total during the period.
As for average loan size, the amount increased to $362,384, 1.3% and 9.6% higher than the numbers of the previous quarter and year, respectively. The amount, however, was still 26.4% below the national average.
Western Australia
Over the June quarter, the share of income Western Australians spent to afford loan repayments decreased to 24%, a 1-percentage-point quarterly and 0.7-percentage-point year-on-year drop.
The total number of loans also fell to 6,855 during the period, dropping 11.4% from the previous quarter and 11.3% from the same time last year. First home buyers also declined to 3,181 between April and June, which was 11.8% of Australia’s first-time homeowners.
The state’s average loan size dropped 2.1% from the first quarter to $397,739, 19.4% lower than the national average.
But WA’s biggest winners were the tenants as the proportion of family income required to meet the median rent fell to 16.1%, the lowest in the county.
Tasmania
Tasmanian homeowners spent 29% of their income on mortgage repayments in the second quarter of the year. The number represents a decline of 0.6 percentage points from January to March and a drop of 1.7 percentage points year-on-year.
Total new loans for dwellings also decreased to 1,575 during the period, falling 9.1% over the quarter and 20.7% from 2019. First home buyers accounted for 518 of the number.
While average loan size increased slightly in the June quarter to $344,825, Tasmania’s figures continues to be lowest among all state and territories, with a loan size 30.1% below the national average.
Surprisingly, Tasmania was the country’s worst in terms of rental affordability with the proportion of income required to meet median rent stood at 28.5%. However, the number was a 2-percentage-point decrease from the previous quarter and a 1.4-percentage-point drop from 2019.
Northern Territory
Northern Territory registered the lowest portion of income allocated for mortgage repayments among all states and territories during the previous quarter at 20.4%. This is a 0.2-percentage-point increase from January to March but a 2.9-percentage-point decrease year-on-year.
NT also has the lowest number of new house loans during the period at 469. Of these, 211 were first home buyers. Average loan size was $358,635, rising 3.5% from the first quarter but dropping 2.9% compared to last year. The amount was 27.3% lower than the national average.
Meanwhile, tenants allotted 20.2% of their income to rental payment from April to June, a 0.4-percetage-point drop from the previous quarter.
Australian Capital Territory
The proportion of income required to meet home loan repayments in the Australian Capital Territory increased to 22.3% during April, May, and June. The number is a 1.1-percentage-point rise from the previous quarter and a 0.1-percentage-point uptick from last year.
The number of loans also rose to 2,051 during the period, with first home buyers accounting for 677 of the capital’s total. Average loan size was among the highest in country at $494,490, next only to Victoria and NSW, although the amount was only 0.2% above the national average.
In contrast, the ACT has the lowest proportion of income needed to pay rent at 19.2%, although rising 0.2 and 0.3 percentage points from the previous quarter and year-on-year, respectively.
