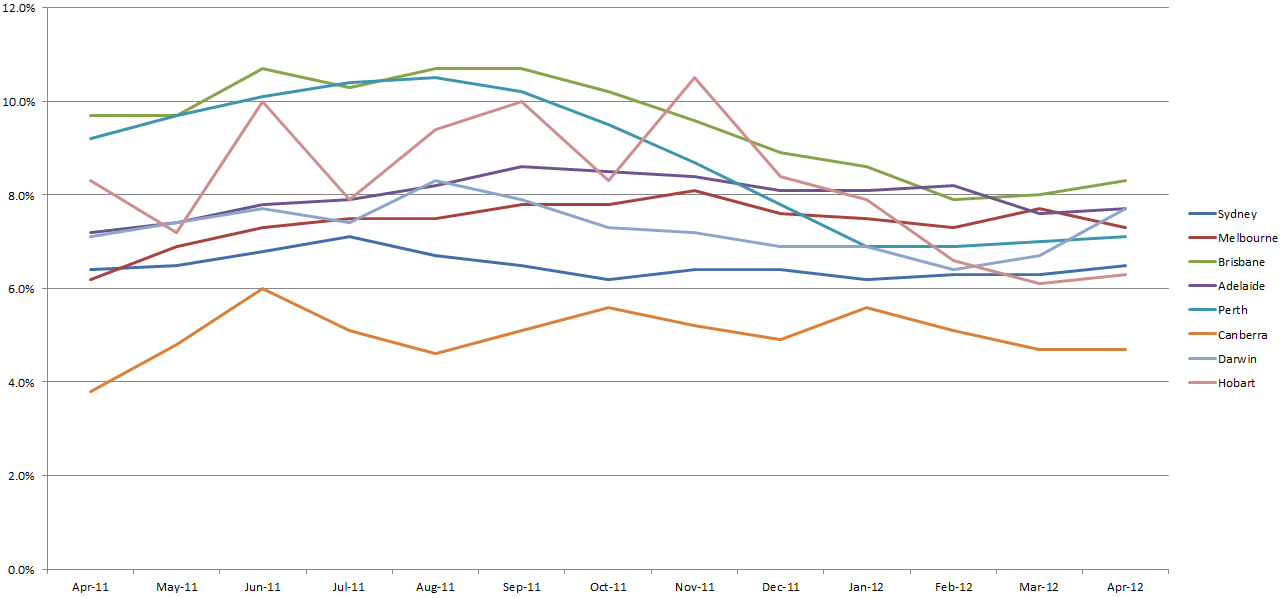
There are encouraging signs that the property market is starting to make a slow turn in the favour of sellers, with vendor discounting showing signs of abating in Australia’s capital cities.
According to the latest data from Australian Property Monitors, all of our state capitals have seen a significant drop in their average levels of vendor discounting since the worrying highs of 2011.
Sydney, for example, saw vendors bring their asking prices down by an average of 6.5% last month, which was 0.6% lower than July 2011’s high of 7.1%. Other highlights include:
- Discounting in Melbourne reached 8.1% in November last year, but is now down to 7.3%.
- Discounting in Brisbane hit 10.7% in August/September 2011, but is now down to 8.3%.
- Adelaide’s average vendor discount was 8.6% in September 2011, but was down to 7.7% last month.
- Canberra reached a high of 6% in June 2011, but saw its average vendor discount drop to 4.7% last month.
- Darwin saw average discounting of 8.3% in August 2011, but this figure was down to 7.7% last month.
- Hobart recorded an average vendor discount of 10.5% in November, but this figure has now dropped to 6.3%.
While the levels of discounting currently being seen still suggest that the balance of power favours buyers, with property market commentator Michael Matusik warning vendors that it’s still a buyer’s market, these statistics suggest that the market may be starting to turn.
|
Month |
Sydney |
Melbourne |
Brisbane |
Adelaide |
Perth |
Canberra |
Darwin |
Hobart |
|
Apr-11 |
6.4% |
6.2% |
9.7% |
7.2% |
9.2% |
3.8% |
7.1% |
8.3% |
|
May-11 |
6.5% |
6.9% |
9.7% |
7.4% |
9.7% |
4.8% |
7.4% |
7.2% |
|
Jun-11 |
6.8% |
7.3% |
10.7% |
7.8% |
10.1% |
6.0% |
7.7% |
10.0% |
|
Jul-11 |
7.1% |
7.5% |
10.3% |
7.9% |
10.4% |
5.1% |
7.4% |
7.9% |
|
Aug-11 |
6.7% |
7.5% |
10.7% |
8.2% |
10.5% |
4.6% |
8.3% |
9.4% |
|
Sep-11 |
6.5% |
7.8% |
10.7% |
8.6% |
10.2% |
5.1% |
7.9% |
10.0% |
|
Oct-11 |
6.2% |
7.8% |
10.2% |
8.5% |
9.5% |
5.6% |
7.3% |
8.3% |
|
Nov-11 |
6.4% |
8.1% |
9.6% |
8.4% |
8.7% |
5.2% |
7.2% |
10.5% |
|
Dec-11 |
6.4% |
7.6% |
8.9% |
8.1% |
7.8% |
4.9% |
6.9% |
8.4% |
|
Jan-12 |
6.2% |
7.5% |
8.6% |
8.1% |
6.9% |
5.6% |
6.9% |
7.9% |
|
Feb-12 |
6.3% |
7.3% |
7.9% |
8.2% |
6.9% |
5.1% |
6.4% |
6.6% |
|
Mar-12 |
6.3% |
7.7% |
8.0% |
7.6% |
7.0% |
4.7% |
6.7% |
6.1% |
|
Apr-12 |
6.5% |
7.3% |
8.3% |
7.7% |
7.1% |
4.7% |
7.7% |
6.3% |
Source: APM
Source: APM
Are you a struggling vendor, or a keen buyer making the most of the market conditions? Tell your story on our property investment forum.
More stories:
Budget unlikely to boost property market

