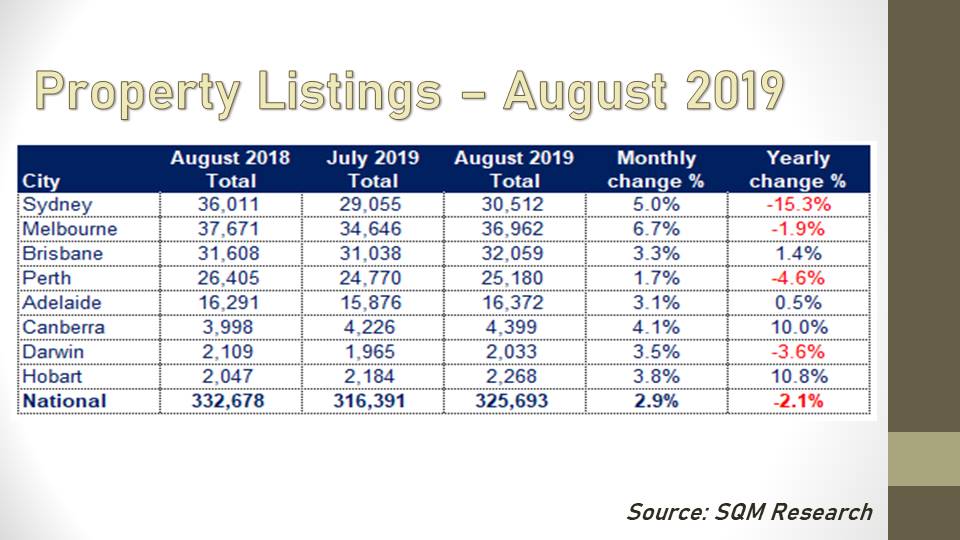
More residential properties went up for sale in August, with listings increasing by 2.9% month over month, figures from SQM Research show.
National residential property listings increased to 325,693 from 316,391 in July. However, listings were down by 2.1% on a yearly basis.
All states witnessed monthly growth in listings, with Melbourne recording the biggest improvement at 6.7%. The Victorian capital also posted the highest number of property listings for the month at 37,671.
On a yearly basis, Sydney registered the most substantial decline at 15.3%. The impact of this slump was mitigated by the robust gains recorded in Canberra and Hobart.
The table indicates how much listings in each state grew in August:
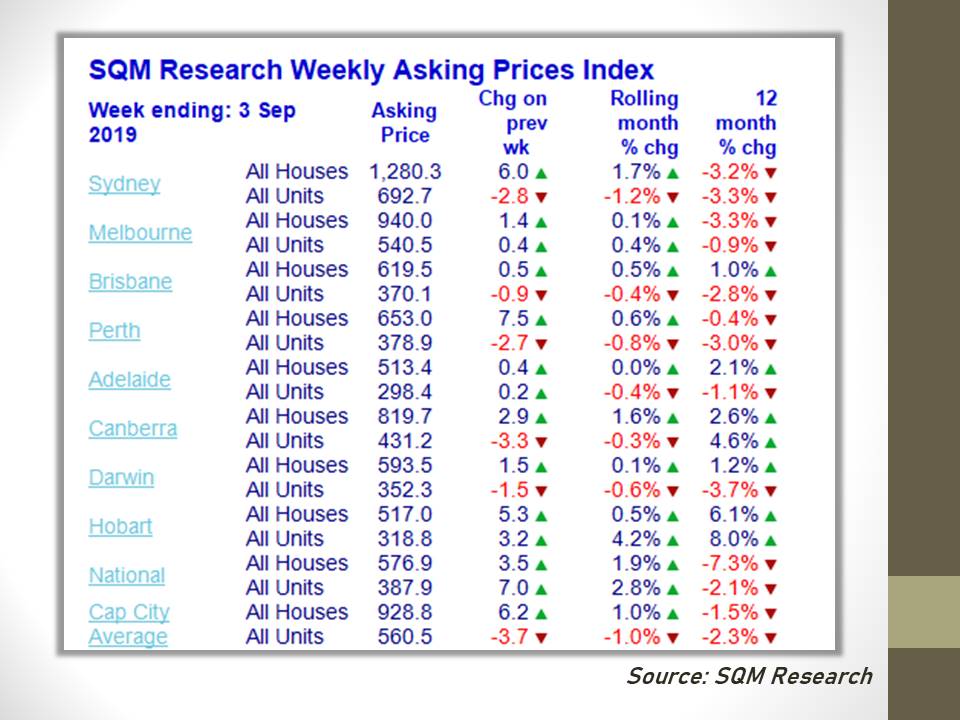
Asking prices tick up for houses
Asking prices for houses across capital cities increased marginally by 1% over the month to $928,800. Unit asking prices, however, were down by 1% to $560,500.
Melbourne’s house and unit asking prices both increased by 0.1% and 0.4% over the month, respectively. Hobart also recorded growth in its house and unit prices by 0.5% and 4.2%.
Compared to a year ago, the capital city asking prices posted declines of 1.5% for houses and declines of 2.3% for units.
The table below shows the changes to asking prices in each state: