Rate cuts are beginning to impact the housing market, according to the latest affordability study by the Real Estate Institute of Australia (REIA).
In the study, REIA found that housing affordability improved across the country as the housing market witnessed the highest percentage of first-home buyers in eight years during the September quarter.
"Although the average loan amount has risen, the increase in family income and the decrease in the interest rates have negated this rise," said REIA President Adrian Kelly.
In fact, the number of new loans to first-home buyers increased by 13.6% over the quarter and 6.8% over the year. The share of first-home buyer loans in the overall home lending is 29.4%, the highest percentage since the 30.3% recorded in December 2011.
The graph below shows the distribution of first-home buyer loans across each state:
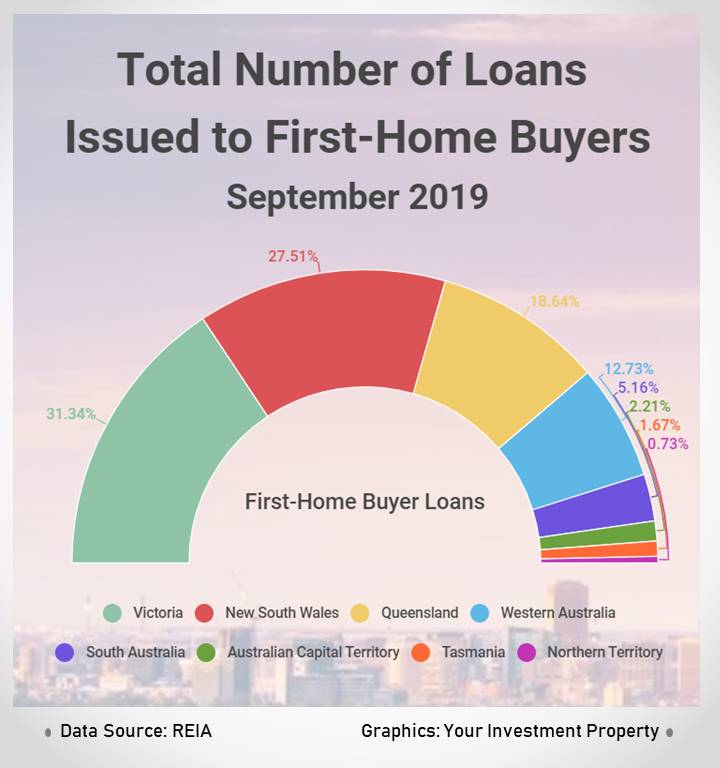
The lending data indicate that Victoria was the most in-demand state for first-home buyers in the quarter, with around one in three loans originating in the state. New South Wales followed with 27.5% of all first-timer loans. The least attractive state for first-home buyers is the Northern Territory.
These results already took into account the back-to-back rate cuts by the Reserve Bank of Australia in June and July, which brought the cash rate to 1%. Three months after, the RBA decided to lower the cash rate further by 0.75%.
Housing affordability improved in all states except Tasmania. This means that the proportion of income required to meet loan repayments has decreased. Rental affordability also improved across the board.
In New South Wales, homeowners need to allocate 36.2% of their income to service their mortgage. This is down by 0.9 percentage points over the quarter. However, New South Wales remained the least affordable state to buy a house in.
The most affordable housing markets are in the Northern Territory, where it only takes 19.2% of a household income to service loan repayments.
The table below shows the improvement in housing affordability in each state:
Housing Affordability — September 2019 Quarter |
|
State |
Share of income needed to meet mortgage repayments |
|
New South Wales |
36.2% |
|
Victoria |
32.2% |
|
Queensland |
27.3% |
|
South Australia |
26.2% |
|
Western Australia |
22.1% |
|
Tasmania |
26.2% |
|
Northern Territory |
19.2% |
|
Australian Capital Territory |
19.5% |
|
Source:REIA |
|
In terms of rents, the most affordable state is Western Australia, where the share of family income needed to meet the median rent is only at 16.3%.
On the other hand, the most expensive state in which to rent a home is New South Wales. While affordability already improved in this state, renters still need to apportion 27.8% of their income to afford median rents.
Interestingly, it is cheaper to service a mortgage than to rent a house in Tasmania. In this state, the share of income needed for loan repayments is only 26.2%. Households renting in Tasmania are shelling out a higher proportion of income for rent at 29.6%.
The table below shows the rental affordability in every state and territory:
Rental Affordability — September 2019 Quarter |
|
State |
Share of income needed to meet median rents |
|
New South Wales |
27.8% |
|
Victoria |
22.7% |
|
Queensland |
21.7% |
|
South Australia |
21.8% |
|
Western Australia |
16.3% |
|
Tasmania |
29.6% |
|
Northern Territory |
19.1% |
|
Australian Capital Territory |
18.3% |
|
Source:REIA |
|
