New figures from SQM Research show that all of Australia’s capital city markets saw increases over September, but that Sydney’s rise dwarfed all others with listings up 7.6% over the month.
In the 12 months to the end of September, Sydney’s listings are up 11.1%.QM Research headLouis Christopher said the increases likely point to a cooling of the city’s market.
“The Sydney surge in listings is another indicator now suggesting that the Sydney housing market is now slowing,” Christopher said.
“Buyers should now find there is a little more choice out there compared to earlier this year,” he said.
But there are signs that not everybody is noticing the slowdown. Christopher believes vendors have not recognised the changing conditions, as asking prices for Sydney housing remain higher than at the same time last year.
While Sydney may be slowing down, Christopher believes the September figures show Melbourne is still in a healthy position.
During September, Melbourne had the smallest increase of any capital, with listings up by only 0.8%.
Over the 12 months to the end of September, listings in the Victorian capital plummeted by 16.9%, the largest decrease of any capital city.
“The Melbourne result is also interesting in that there was barely any movement at all in listings in September and that stock for sale is well down on this time last year,” Christopher said.
“This is suggestive of a strong housing market that is not slowing down at all.”
After Sydney, Brisbane and Adelaide saw the largest listing increases over September, with stock on market increasing by 3.2% and 2.3%, respectively.
Darwin was just beaten by Melbourne as the city with the smallest increase, with listings in the Northern Territory capital increasing by 1% during September.
Over the 12-month period, Darwin had the largest yearly increase as listings rose by 22.1%, followed by Perth’s increase of 16.3%.
Following Melbourne’s annual decrease, the next biggest yearly fall was in Hobart, where listings fell 9.9%.
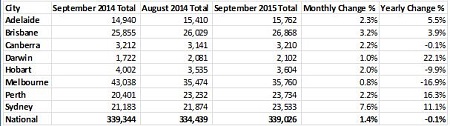
Source: SQM Research

