.jpg) According to the latest RP Data report, Perth suburb Peppermint Grove recorded an eye-popping growth of 40% during the past 12 months, resulting in capital growth of $1.175 million. During the past quarter alone, median house price surged another 10%, indicating that there’s plenty more upside to come.
According to the latest RP Data report, Perth suburb Peppermint Grove recorded an eye-popping growth of 40% during the past 12 months, resulting in capital growth of $1.175 million. During the past quarter alone, median house price surged another 10%, indicating that there’s plenty more upside to come.
Property owners in Sydney’s Tamarama enjoyed a massive $837,428 capital gain –a growth of 40% year on year.
Median house price for Lower North Shore suburb of Northbridge grew by $535,000 while beachside suburb Palm Beach saw house prices growing by $517,000 within 12 months alone.
The RP Data figures for January 2014 also showed that a total of 272 suburbs now have a median of $1 million or more compared to 188 suburbs during the same time last year.
Of the million dollar suburbs with a median price of at least $1 million, RP Data said 56% were in Sydney in New South Wales and 20% of suburbs were located in Victoria. These were then followed by Western Australia (12%), Queensland (6%), South Australia (3%), Australian Capital Territory (2%) and Northern Territory (0.5%).
The Rich Club
| State | Suburb | Property type | Median Price Jan 2014 | Median price Jan 2013 | Capital growth $ | 12 month Growth | Gross Rental Yield |
| WA | PEPPERMINT GROVE | H | 3575000 | 2400000 | 1,175,000 | 40% | 2% |
| NSW | TAMARAMA | H | 2931000 | 2093571 | 837,428 | 40% | 3% |
| NSW | NORTHBRIDGE | H | 2205000 | 1670000 | 535,000 | 33% | 3% |
| NSW | PALM BEACH | H | 2179500 | 1662500 | 517,000 | 31% | 2% |
| NSW | GLENORIE | H | 1067500 | 599500 | 468,000 | 43% | 3% |
| NSW | BIRCHGROVE | H | 1625000 | 1170000 | 455,000 | 38% | 3% |
| NSW | ZETLAND | H | 1200000 | 755000 | 445,000 | 48% | 3% |
| NSW | ROSE BAY | H | 2235000 | 1815000 | 420,000 | 29% | 3% |
| NSW | WAITARA | H | 1121000 | 750000 | 371,000 | 49% | 3% |
| NSW | LONGUEVILLE | H | 2490000 | 2120000 | 370,000 | 17% | 3% |
| NSW | SANDRINGHAM | H | 1490000 | 1121000 | 369,000 | 35% | 3% |
| NSW | KANGAROO POINT | H | 2455000 | 2100000 | 355,000 | 20% | n.a |
| NSW | BELLEVUE HILL | H | 3275000 | 2950000 | 325,000 | 11% | 3% |
| NSW | MILSONS POINT | U | 1140000 | 832500 | 307,500 | 34% | 3% |
| NSW | ROSEBERY | H | 1100000 | 832500 | 267,500 | 32% | 4% |
| NSW | BALMAIN | H | 1287000 | 1035000 | 252,000 | 23% | 3% |
| QLD | ASCOT | H | 1110000 | 868000 | 242,000 | 23% | 3% |
| VIC | PRINCES HILL | H | 1190000 | 950000 | 240,000 | 27% | 2% |
| NSW | WAHROONGA | H | 1200000 | 960000 | 240,000 | 23% | 3% |
| NSW | GLADESVILLE | H | 1200000 | 970000 | 230,000 | 22% | 3% |
| NSW | EPPING | H | 1167500 | 941500 | 226,000 | 24% | 3% |
| NSW | DENISTONE EAST | H | 1080000 | 860000 | 220,000 | 24% | 3% |
| NSW | MOSMAN | H | 2300000 | 2100000 | 200,000 | 12% | 3% |
| NSW | MARSFIELD | H | 1050500 | 855000 | 195,500 | 23% | 3% |
| NSW | DULWICH HILL | H | 1041000 | 851500 | 189,500 | 22% | 3% |
| SA | LEABROOK | H | 1075000 | 888000 | 187,000 | 44% | 3% |
| VIC | SOUTH YARRA | H | 1140000 | 1035000 | 105,000 | 28% | 3% |
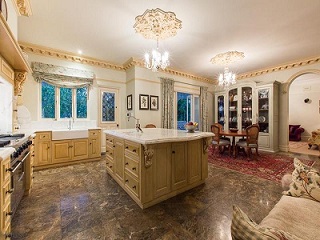
Images: Peppermint Grove home currently listed on www.realestate.com.au for buyers in the vicinity of $7.5 to $8.5 million
