How do you know when it’s time to sell? Jeremy Sheppard examines the factors you need to consider before cashing in on your property.
Most investors only think about using the law of supply and demand when looking to buy their next investment property. But supply and demand are also crucial when considering whether to hold or whether to sell and when to do so.
It is well understood that prices for any commodity or service will go up if demand exceeds supply and go down if supply exceeds demand.
To quickly gauge the imbalance in demand and supply for Australian residential property markets I use the demand to supply ratio (DSR score) that is published in the back of this magazine. If you haven’t seen it before, flick to page 102 to see what I’m talking about.
The DSR score takes some of the better known statistics such as vacancy rates, auction clearance rates, yield, stock on market, days on market, etc and “munges” them all into a single figure called the DSR score. The higher the score, the better the potential for price growth to occur.
Opportunity costs
Buying a $300,000 property that experiences 5% growth per annum over the next two years instead of buying one that experiences 10% growth per annum will cost you $30,000 in lost opportunity (10% - 5% x 2 x 300,000). This loss is what most investors focus on. But the loss of hanging on to a property in a dud market can be almost as expensive.
Holding onto a $300,000 property for two years in a flat market when you could have invested the money in a market experiencing 5% growth is not actually a $30,000 loss over two years.
By hanging on to the property you avoid paying the costs associated with recycling equity. For this reason many property advisors recommend investors “buy and never sell”. The “buy and never sell” recommendation has one big flaw. That flaw is the word “never”. Almost as soon as you say it, exceptional circumstances start occurring to prove you wrong. I have sold properties I bought with a plan to never sell. But when I did sell, it made perfect sense. It all came down to the numbers.
If supply is exceeding demand, a decline in prices might only be slight – like a 5% drop. But it is usually the time it takes for the market to recover and start growing again that is the killer. Most markets spend more time flat than they do falling. It’s the time you have your money invested in a poor market while others are booming that hurts – it’s the opportunity cost.
Time in vs timing the market
I admit, the more time you have money invested in the property market, the more wealth you will create because of the basic nature of compound growth. But that compound growth is not constant, it usually happens in short surges and is followed by long flat periods. You can accelerate your wealth creation if you know when the right time is to enter and exit the market.
Passive buy and hold investors who plan to never sell actually put themselves at risk if they don’t keep an eye on their markets. On the other hand, the investor who wants to occasionally sell will need to be more observant, they will have to keep their finger on the pulse of every market they own property in.
SMSFs
I’ve noticed a lot of interest recently among investors in buying property in their super fund. A lot of rules have been changing with respect to this. Investors who follow this path will need to alter their attitude about super funds. Fund managers keep an eye on their clients’ investments. But we, the beneficiaries, usually have a rather passive attitude.
Once you own property in your super, you will need to change your attitude and be more vigilant, giving not be the “set and forget” investment you thought it was.
When to sell – calculating costs
Whether to sell or hold is both simple and complicated. The simple bit is, if the opportunity cost exceeds the recycling cost, then you sell. The complicated bit is calculating all these costs accurately. You’ll often find estimating the future capital growth is the most inaccurate part of your estimating. And remember you need to estimate the future capital growth of both the property you own and the one you intend to replace it with.
The DSR score can’t accurately estimate a capital growth figure. But it can be used as a very rough guide. The average DSR score for most of this year has hovered around 22 out of a maximum of 48. And the long term national capital growth rate is around 6%. So, in a “normal” market, you can assume a benchmark of 6% growth and adjust that up or down a few percentage points depending on where your market’s DSR score lies, where interest rates are and the general confidence in the economy. That will give you a ballpark figure.
When to sell – examining the market
If the DSR score for your market has been dropping consistently over the last year this should trigger alarm bells. Similarly, if the DSR score has edged into the “very poor” category, you should be on your guard. Do some research and find out if anything is hampering demand like a council plan to have the region’s rubbish dump moved to your suburb. Also, see if the problem has been an increase in supply. Check the council website to see what development applications have been approved that may bring even more supply to the area.
Leases
To maximise the number of potential buyers for your property, it is preferable to have it empty. Having a tenant may be a bonus for an investor, but an owner-occupier will usually want vacant position.
It is important to perform your research early before the market really starts to slide – assuming it is going to. Remember, if you have a long period outstanding on the lease, you can’t just kick your tenant out. Even if the lease is “periodical”, you will still need to give your tenant about two months notice.
Check with your property manager what obligations you have to determine how soon you can exit. Remember that each state has different tenancy laws and each lease may have specific conditions. Here’s a hot tip that could save you tens of thousands of dollars. Ask your property manager to remind you three months prior to a lease expiring. When you get the reminder, spend no more than one month checking the health of the market and make a decision whether to sell or not. This will be two months before the end of the lease, which gives your tenant plenty of notice.
Also, remember that once your tenant vacates, you may need to perform a few touch-ups to the property before allowing inspections from potential buyers.
As a minimum, expect at least four months to pass from the time you start checking the health of the market to the time you get your first offer from a buyer. This highlights the need to not only act fast but to also understand the future movement of the market ahead of the pack.
If the market was not in a good position to begin with and it starts to slide quickly, it may be better to put the property on the market with a tenant pre-packaged for the next owner. Waiting for the tenant to clear out may actually cost you valuable time in a falling market.
Cash-flow considerations
Demand may be dropping with respect to supply, which is affected by owner and buyers. But so long as both vacancy rates and yields are maintained, there should be no panic to sell for the cash-flow focused investor. Of course, if something fundamental to the nature of the local economy is the cause of dropping demand to supply, then even positively geared properties are at risk.
If you find your market’s DSR score is dropping, have a look at which statistics are causing this. Is it vendor discounting and days on market that are increasing? Or is it vacancy rates and yield?
Note that some strong price growth without accompanying rental growth will cause yields to drop. This is nothing to complain about though. If you own property in this kind of market, you’ve probably already received some capital growth. Yields may increase because prices are falling. You want yields to increase because of rising rents, not falling prices.
Check the charts of recent prices to see what the cause is.
Case in Point
Figure 1 shows a chart of the DSR score from January 2010 to October 2013 of the housing market in Coombaba QLD. There is a noticeable slide in DSR values to a bottom in July 2011 and then some recovery.
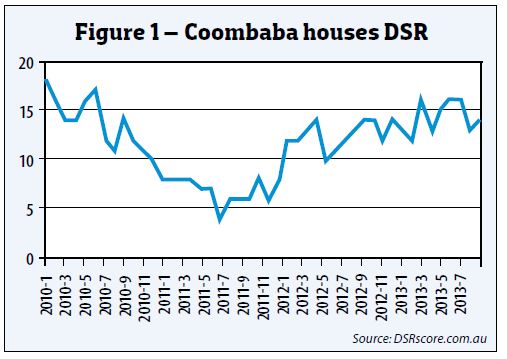
There was a bit of volatility in DSR scores for most of 2010 in Coombaba but enough clarity to see a downward trend. The drop was significant enough to trigger a sell signal by the end of 2010. Note, a DSR score of less than 16 is considered “poor” and less than eight, is considered “very poor”. It’s not easy selling around the Christmas/New Year period, but assuming you could sell sometime in February to April 2011, the price would’ve been around $400,000, as can be seen in figure 2.
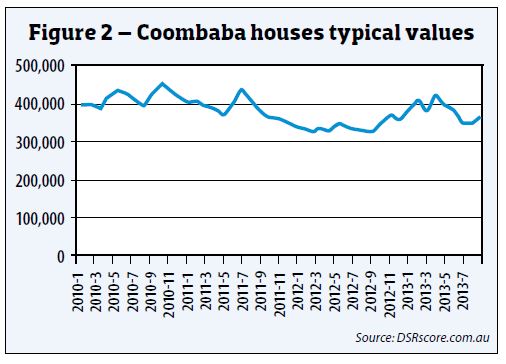
Over the next year, prices dipped to around $340k and stayed there for about another year while the DSR scores gradually recovered. Towards the middle of 2013, the DSR score had returned to where it was in early 2010 and prices have started to recover much of their losses.
The patient investor who chose not to sell would’ve saved recycling costs but lost opportunity costs over two years. The more active investor would’ve sold and reinvested the money in a market that may easily have increased in value by 15% over the same timeframe.
Note the DSR started falling in January 2010, but the prices didn’t start to fall until the DSR had gone below 15. Also, note the DSR started climbing in July 2011, but didn’t reach a score of 15 till April 2013, which is when prices came back to around $400,000.
Markets in the doldrums don’t drop significantly in price despite supply outweighing demand. Instead, they tend to have prolonged flat periods with only moderate decreases in price. Sellers hang on waiting for the market to recover rather than throw away their properties cheaply. The market just gets quiet, but prices don’t usually plummet.
The dip in the DSR in figure 1 pre-dates the dip in the typical values in figure 2. This is because the DSR is a lead indicator. When demand exceeds supply, it takes time for the market to balance out, usually with price growth dampening demand. Similarly, when supply exceeds demand it takes time for the demand to catch up, usually after excess supply has been absorbed or when prices have dropped enough to lure buyers back.
Figure 3 shows the DSR for West Melbourne houses over the past few years.
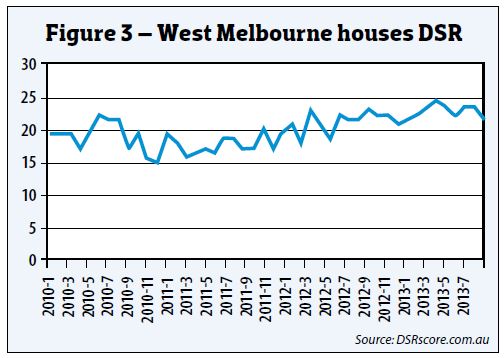
West Melbourne houses have experienced some volatility in DSR scores from early 2010 to early 2013. There hasn’t been a definite sell signal even though the DSR score got as low as 15 on a number of occasions.
If investors had used the DSR score of 15 as a sell signal back in June 2011, they would’ve sold a house for about $800,000, see figure 4. Although prices have momentarily come back as high as $800,000, the typical value at the end of October 2013 is about $600,000.
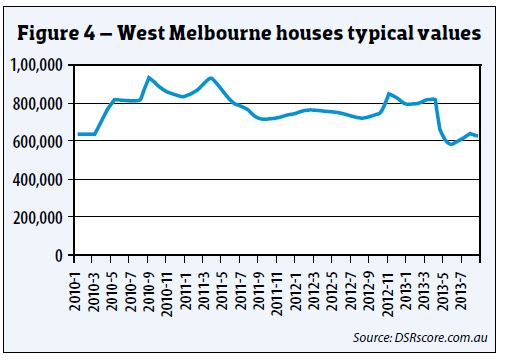
Given the DSR is now back to a balanced position, I would expect to see some moderate growth in this market. But a lot of growth is required to bring the prices back to where they were in early 2011.
Southport
Back in the May 2012 issue of Your Investment Property, I wrote an article taking a look at Southport in QLD. A senior executive at one of the big four banks asked me for a review of the Southport unit market in September 2011 because his sister had bought there a few years earlier.
I didn’t even know where Southport was at the time and I didn’t have to either – a few minutes spent examining the DSR and its indicators gave me a clear picture. The DSR score at the time was seven, which is very poor. Figure 5 shows what happened to prices over the next two years.
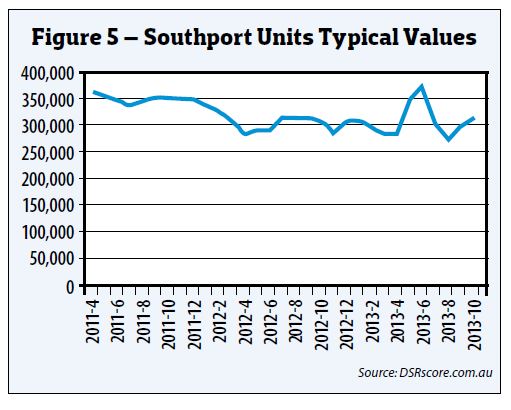
As you can see from figure 5, prices dropped by more than 10% and stayed consistently low for almost two years, except for one brief respite in the middle of 2013. This brief respite is undoubtedly a statistical anomaly rather than genuine capital growth.
Although the DSR score for Southport has come back to 16, as at the end of October 2013, there is still some supply to be absorbed before prices can start heading north again.
Region versus City
If you live in a city and have lost your job, you probably don’t need to move, you just commute to a new work address. But the loss of a job in a rural area may mean packing up and moving. This is one of the reasons regional markets tend to be more volatile than city ones.
A single industry going belly-up in a city is inconsequential to the property market there. But in a regional area it can be devastating. Regional markets can remain depressed for decades following the closure of a single business. But city markets will rarely remain flat for as long as 10 years – even if several business fold.
If the demand to supply ratio drops off in a city market, there is some cause for concern. But it doesn’t necessarily mean you need to put your property on the market. If you own property in remote locations, however, you need to find out ASAP what the cause was to know if this is the “start of the end”.
At the end of October 2013, I found 42 markets across Australia that had a very poor DSR score. Only seven of these markets are located within 100kms of a major capital city:
Over half the markets that are DSR scored and published each month are within 100kms of a major capital city. But less than one fifth of the very poor markets are within 100kms of a major capital city. This confirms to some extent that city markets will have more sustainable prices than regional markets. They are of a lower risk but also provide lower rewards, whereas regional areas have higher risk but higher potential rewards.
Watch out for these
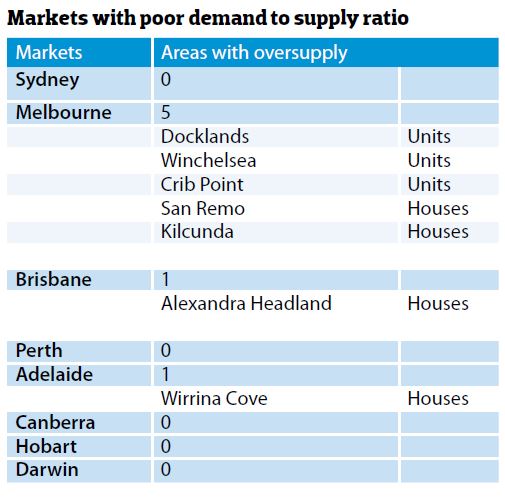
Following is a list of some markets you may have heard of before that right now are in a state of significant oversupply with respect to demand.
All these markets have a very poor DSR score:
| Watch list-Areas withpoor demand to supply ration | |
| Airlie Bear, Qld | Houses and Units |
| Poor Hedland, WA | Units |
| Bowen, Qld | Houses |
| Port Douglas, Qld | Houses |
| Docklands, Vic | Units |
You can examine these markets more closely to see the characteristics of what happened and learn to look out for this where you have investment exposure or where you plan to buy next. Most of these cases are where developers have gone nuts creating a state of over-supply.
Airlie Beach and Port Douglas are examples of developers capitalising on baby-boomers retiring to holiday lifestyles of sun and sand. Port Hedland and Bowen are examples of developers capitalising on the resources boom. Docklands is a case of capitalising on a brief boom in Melbourne prices across 2010, expecting them to continue, combined with increased interest from foreign investors due to a falling Aussie dollar.
Inexperienced developers often overlook the supply side of the equation and focus on demand. They hear some big news in the media about a location and think they can’t lose. So they quickly knock up a set of three townhouses or a duplex.
The experienced developers have already entered the markets with promise. But their projects are much bigger and take longer to complete. At the time they do eventually complete, the market may already be flooded by novice developer stock and the oversupply is now exacerbated.
Final thoughts
Keep an eye on the markets you have exposure to on a regular basis. Once demand has dipped too far below supply it will be too late to try and sell. Rather than put yourself in a “tough it out” situation, stay vigilant and be ready to make the hard decisions – quickly – like a professional, unemotional investor.

Jeremy Sheppard
is head of research
at DSRdata and LocationScore
