Jeremy Sheppard calculates the cost of selling versus the cost of holding on to your investment
Almost every property investor at some time or another has asked themselves whether or not they should sell an investment property they currently own. There are so many variables to the equation that making a decision can end up feeling like guesswork. I’ll outline a few key points in this article, hopefully to make it easier for you to get back to sleep next time the question pops up.
The general rule
The general rule in Australia touted by most property investment gurus is: “Buy and never sell”. The problem with general rules is just how frequently life throws curly circumstances at you, making those general rules seem almost rare.
For example, what if you found out you had cancer and there was a leading new treatment available in the US that could be your only chance of survival, but having this procedure would be expensive? You simply don’t have the money to pay for it. If you sold one or two of your properties you would have the money, but the experts say buy and never sell, so unfortunately you’re doomed.
What if your business was in a boom period and you had the opportunity to expand but not the money to expand because it was all tied up in real estate. It might make more sense to sell and put the funds into your booming business.
What if you had a negatively geared portfolio with $5m in equity? Do you wait until your portfolio is cash flow positive and enough to retire on? It might be better to ignore the advice of the experts and sell some of your portfolio and retire now.
You can ‘manufacture’ equity by renovating, subdividing or developing. Investors who manufacture more equity than they acquire through natural capital growth will find it more profitable to buy and sell frequently because each new purchase presents an opportunity to add value. If most of your profit comes from adding value, then you shouldn’t let the general rule to “never sell” bother you so much. Of course, there’s nothing like getting rich from sitting on your hands and letting capital growth do its thing.
Another reason to consider selling is mental health. If you’re continually worrying about your property because it is in a flood-prone area or because it is a regional town whose economic fortunes are on a knife edge, then it may be better to sell just to alleviate the stress.
Stress, as a factor, is hard to quantify objectively. But since profit and loss are measured in terms of dollars, it may be easier to express your stress in the same units. How much would a holiday every year worth $8,000 help alleviate the stress? How much would it cost to get mental counselling of some sort? Whatever your methods are, there may be a case in which selling works out to be a viable option.
If you can understand the reasoning behind the general rule, you can check if it still applies to your specific case. And the reason why experts recommend buy and never sell is the tremendous costs of ‘recycling equity’ in this country.
Recycling equity
Recycling equity is the term used for the process of selling a property you currently own and then using the sale proceeds to buy a different property. The costs of buying, apart from the deposit, will include many of the following:
- Valuation
This is usually only about $200 if it’s not free.
- Loan establishment fee
This is only a few hundred bucks but more than likely free.
- Lenders Mortgage Insurance
This is generally applicable if the loan-to-value ratio is greater than 80%, but if applicable it will cost thousands.
- Professional inspections
These will usually cost around $500 in total and include:
- building inspection
- pest inspection
- strata report
- Stamp duty
This is the biggie. It will cost you thousands. Check out the Office of State Revenue for the state in which the property is located. They may have an online calculator you can use to get a precise figure. Although it can be waived in the case of first home buyers, investors will probably never be able to get away without paying stamp duty.
Legal fees
These are roughly $1,000 but probably double or triple that if you’re establishing a new corporate entity and/or trust.
And then, of course, there is the cost of your own time to perform the research, arrange finance, negotiate a deal, do all the paperwork, liaise with everyone involved, etc. Your time could add up to as much as a hundred hours. If your time is worth $40/hour, then this would be a cost of $4,000.
I always draw up a detailed spreadsheet when I’m getting serious about potentially buying an investment property. All up I usually find that 5–7% of the value of the property is lost in purchase costs. Prior to the detailed spreadsheet, I use 5% plus the deposit as a rough guide for a target price according to my budget.
The costs of selling include:
- agent’s commission (say 2.5%)
- more legal fees (another $1,000)
- possible break costs for the mortgage (uh-oh if you had fixed interest!)
- capital gains tax (CGT) (speak to your accountant to get an approximate figure before making a decision)
And again, of course, there is the cost of your own time. In the case of selling, you need to figure out if it’s a good idea and you need to organise an agent, liaise with them regarding the sale, and do all the paperwork. There is not nearly as much effort involved in selling as there is in buying, so allow only $1,000 for your own time.
Depending on the sale price of your property, the total cost of selling could be around 3.5% of the value of the property without even including CGT. You should consult a tax expert to get at least a rough gauge of the cost of CGT.
Let’s assume you have owned a property for about seven years and in that time you have seen its value grow by 60%. Because you have held the property for more than 12 months, the 50% CGT discount applies. So you will only end up paying tax on 30% of that capital gain, and there may be other deductions you can claim such as some of those ‘entry’ costs. Let’s say that because of your tax rate it ends up being one third of the total gain, or in this case 10% of the value of the property in total.
- Total cost of recycling equity
So what are you looking at as the total cost of recycling equity? This includes:
- 5% spent on entry costs
- .5% spent on exit costs
- 10% due to CGT
Total: 18.5% of the property value
This is a very rough estimate. A comprehensive spreadsheet would be worthwhile. Assuming 7% per annum growth in the new property, it would take almost three years to recoup these losses. So why would you ever want to sell?
Opportunity cost
I like the Wikipedia definition of opportunity cost:“Opportunity cost is the cost of any activity measured in terms of the value of the next best alternative forgone (that is not chosen). It is the sacrifice related to the second best choice available...”
Let’s say you have done all your research and you cannot decide between two possible investment opportunities. One is in suburb “Xyz Heights” and another is in “Abcville”. You can only afford to buy one, not both, and you eventually decide to buy in Abcville.
After five years you check to see how your next best alternative has gone and are disappointed to see that the property you were going to buy in Xyz Heights has just sold for double its original value. Your investment in Abcville has grown but only by 60% over the same timeframe.
Because you could have made a better investment, you have an opportunity cost. Don’t worry – this isn’t some weird kind of tax you have to pay; it is just a way in which you can reflect on your performance as a property investor. Five years ago you had two clear choices, and you chose one. If the option you didn’t choose outperformed the one you did choose, then the difference is the opportunity cost.
The cost of investing in Abcville versus in Xyz Heights is 40% over those five years. One investment achieved a 100% improvement in value, the other only 60%. The difference is 40%. This is assuming everything else was equal; that is, the rent, insurance, repairs, depreciation, management fees, land tax, etc., were all the same.
When multiplied by the value of the property, you can see that opportunity cost is a lot more expensive than stamp duty. If the property’s value was $200,000, your opportunity cost would be a whopping $80,000! Luckily, it isn’t a payable tax. This highlights how important it is to get each new purchase right.
But that opportunity cost example is not as tragic as if you had been paralysed and not made any investment at all. Your deposit would have earned interest in the bank at a measly rate, which you would have paid tax on anyway. And the value of those dollars would have been eroded by inflation.
Let’s assume having that money in the bank at 4% interest earned you a net profit of 2% after inflation and tax. If the original purchase price was $200,000, then the entry costs would have been around $50,000. So let’s assume you had $50k in savings to invest in the bank or property. Two per cent of $50,000 would be $1,000. Compounded over five years, you’re looking at $5,204, or about a 2% return on investment for leaving the money in the bank.
Putting money in the bank may have been less risky, but the opportunity cost would have been even more extreme. The Abcville investment grew by 60%. If you had sold it and lost about 14% on the sale due to CGT and other exit costs, the net proceeds from the sale would have been roughly $125,000. The opportunity cost of leaving your money in the bank versus your second best property investment would have been almost $120,000 over five years.
There are two key lessons to learn here:
1. Put a lot of effort into the decision to invest to reduce opportunity cost.
2. Make sure you do actually invest rather than sit on the sidelines.
There’s another way of looking at opportunity cost, which I need to cover before we can complete our consideration of whether to sell or hold. What if you have an existing property with no equity to draw on in order to buy another property or perhaps not enough serviceability to buy another? You may think opportunity cost doesn’t apply to you, since you can’t buy, but it does apply since you can sell.
If you already owned the Abcville property and sold it in order to buy the Xyz Heights property, would you be better off? We already know the opportunity cost difference between these two investments was 40%, so you’d think it was a clear winner. But what about the recycling cost?
Opportunity cost should consider the total-after-tax return on investment. It should take into account the entry and exit costs where applicable. You need to consider holding costs, land tax, income tax, everything, in order to make fair comparisons.
Why sell?
You’ve probably already figured it out, but just in case you haven’t: an investor should sell if the cost of recycling equity is less than the opportunity cost of an alternative investment. Sounds pretty simple – you just add up the recycling costs and the opportunity costs and see which one is bigger. But there are two tricky aspects to these calculations:
- estimating future capital growth and
- deciding on the timeframe
The recycling cost is calculated more or less instantly; that is, you can sell a property and buy another in a few months. But the opportunity cost of capital growth will be measured in years, not in months. So the comparison of recycling equity costs to opportunity costs needs a timeframe. This isn’t hard and it’s up to you to decide.
Set a timeframe over which both the property you currently hold and the one you’re thinking of replacing it with will be examined. Ask yourself this question: “How long will I give each investment to prove itself?” Your answer may be three years or one year or five years or two years. It doesn’t matter that much, but months would be a poor comparison timeframe, as would 10 years. What matters is that you choose a timeframe that suits you, and then base all your estimates, like capital growth, on that timeframe.
Estimating future capital growth
We all know it’s not really possible to accurately predict capital growth. Investment comes with some risk, after all. But we can get a pretty good idea, especially for short terms like two years or less and for longer terms like 20 years or more.
Long-term predictions are pretty easy. The long term average growth rate for any First World nation over the last few hundred years would be a decent benchmark to start with.
Short-term capital growth predictions are easier than mid-term ones because you can get a lot of information about a property market currently. Property markets aren’t that volatile and so not a lot is likely to change in two or three years. If something radical is about to take place, you can usually uncover that through some fundamental research.
Price growth will happen when demand exceeds supply. You need to determine the level at which demand exceeds supply to have any hope of estimating future capital growth. A market’s current demand-and-supply situation can easily be determined by looking at the Demand to Supply Ratio (DSR) score, which is available in the data section at the back of this magazine or via the free online tool Boomtown (www.DSRscore.com.au/boomtown).
However, converting a DSR score into a capital growth prediction is very difficult. This is why at Redwerks we don’t publish such a figure. There are other enterprises that will stick their neck out and offer predictions of capital growth. But they usually do so for very large markets like Sydney, Southeast Queensland, Tasmania, or even all of Australia.
You cannot assume your property will experience the same growth rate as the suburb in which it is located, let alone its local government area or its city or state. So, even city growth predictions will not help you, even if they turn out to be spot on.
The chart below shows the last three years’ average growth rate for each DSR score from 4 to 43 as recorded back in January 2010. The figures in the chart were calculated by averaging the growth over the last three years that all markets with a DSR of 4 to 43 had.
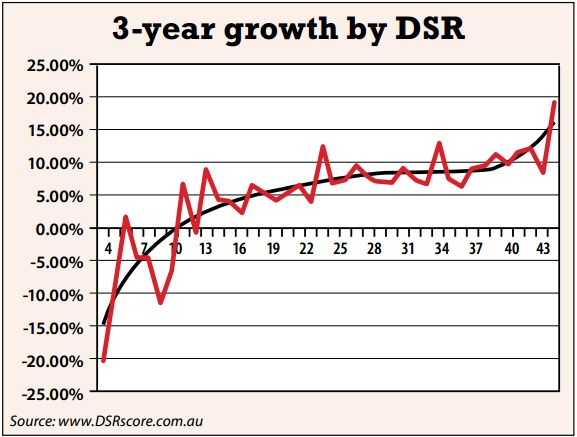
You can see at the bottom left of the chart that markets with a DSR of 4 in January 2010 have experienced average growth of minus 20% in the three years up to January 2013.
Then I did the same for all markets that had a DSR score of 5 and 6 and so on all the way up to the top score at the time, which was 43. At the top right of the chart you can see that suburbs with a DSR of 43 in January 2010 have experienced almost 20% capital growth over the same period.
The chart quite clearly shows that the higher the ratio of demand to supply, the higher the potential is for capital growth. However, note that the chart is quite volatile (ie squiggly). This means that you cannot confidently say that a market with a DSR score of 29 will always outperform a market with a DSR score of 28. But at least you can see that the bigger the difference in demand to supply, the more confident you can be of better capital growth.
The smooth line that cuts through the middle of most of the squiggles is a 4th order polynomial line of best fit. I’ll refer to it as the ‘fancy’ line. You can see that the fancy line crosses the 5% capital growth line at a DSR score of 17. That means that if you bought in a market with a DSR score of 17 back in January 2010, you would be looking at about 5% capital growth over the last three years.
Keep in mind that these are very rough estimates. The DSR score is not the only statistic we look at when researching for our clients at Redwerks. And, like us, you should also perform comprehensive research of a fundamental nature beyond the statistics.
Also, keep in mind that the last three years were a different overall property market to what the next three years will probably deliver. There is no guarantee that the growth rates will be the same.
Furthermore, be aware that the markets considered in these calculations number about 10,000 out of a total of about 30,000 Australia-wide. There are roughly 15,000 suburbs in Australia, and each one has the potential for a house and a unit market. That makes 30,000 markets. Two thirds of the Australian property markets are weeded out due to insufficient statistical reliability. I mention this because the relationship between the DSR and three-year capital growth was for a limited set of the entire Australian market.
Finally, be sure to check the graphs in Boomtown showing how the DSR has changed recently for your market of interest. A low DSR should not automatically trigger ‘sell’ alarm bells. If the DSR is trending upwards, it may be that some change is happening to that market that will increase the gap between demand and supply in the not too distant future.
Regional vs city
Regional markets are usually more volatile and risky than city markets. This is because city markets have tremendous economic diversity. If the entity you work for in the city goes belly up, you may still find work elsewhere in the same city and you may not need to move. In a regional market, the options are not as great, and people may be forced to move in search of work.
The reason I bring this up is that if you see a dipping DSR in a regional market, your incentive to sell should be greater than in a city market. A regional market can be depressed for decades, whereas city markets should experience some growth within a 10-year span. So the general rule of buy and never sell should not be adhered to so strictly in regional markets. It makes more sense, though, in city markets.
Some other considerations
If you already have some equity in a property and your serviceability is good, you may not need to sell in order to buy another property. If you can borrow against the equity in an investment to buy another, then perhaps the opportunity cost will not be so great because you can actually buy the best investment rather than watch it pass you by. Then the opportunity cost for not selling is measured against the second best alternative, not the best.
If you have a truly long-term outlook, like a couple of decades for regional areas or seven to 10 years in city markets, then it may not be such a big deal to hang on to a property. Young investors more so than older investors should be encouraged to hang on to property, since the young have more time on their side.
If you own property that is cash flow neutral or cash flow positive, then holding costs are less of a concern. This means your opportunity cost won’t be as bad as for a negatively geared property. If the positive cash flow is significant and the future capital growth is hard to predict, then it may be worth your while to just hang on.
Conclusion
In order to answer the question of whether to sell or not, you need to calculate the cost of recycling your equity and the opportunity cost of not doing so. If your strategy involves the manufacture of a significant amount of equity, as is the case for some of our clients, don’t be afraid to sell. If you prefer the buy-and-hold strategy, you’ll need to keep an eye on your market and regularly recalculate opportunity costs. Your estimate for capital growth becomes a key factor for either approach.

