Download the full magazine article by Sam Saggers: Timing the market: When to get in, when to cash out
Many investors believe timing the market is not as important as time in the market. Sam Saggers weighs in and explains why you stand a better chance of succeeding and making a bigger profit if you know when to get in and when to get out
Many investors stick to the principle of ‘time in the market’ rather than ‘timing the market’.
I would argue this is a fallacy. You can certainly wait and hope. Real estate will inflate over time. I would rather learn where the market is going to serve me best and buy there.
The real estate lesson for investors is that, if you have capital, you need to work that capital as fast as possible.
You must move money and follow the upward-trending areas. You need to manage your money by understanding various markets and where to buy next. Australia is blessed with different state-based property market cycles that all have different patterns. It allows us to move our money to the next happening location.
Counter-cyclical investing
There are two principles that excite or deflate a market. One is affordability and the other is sales volume.
Sales volume has a direct correlation with sentiment. Sentiment is the most exciting and dangerous side of any marketplace. When people aren’t buying, you can get a great deal; and when people are buying, you can sell and make lots of money. So the lesson is: you need to run counter-cyclical to the psychology of other people.
If you follow the pack, the market can bite you.
A good example of a popular world market that has imploded based on everyone buying fast and expanding sentiment is the Dubai property market.
Once the epicentre of the global property boom, with skyscrapers seeming to rise into the sky daily and buyers making a living by flipping properties before completion, today Dubai resembles a nasty hangover.
Everything has a limit; usually this is because a market can only sustain so much before it either becomes too expensive or oversupplied. The principles of the market will then change.
Dubai was extreme, but there are examples of local extremes as well.
In 2011, Moranbah, a small coal-mining town in Queensland, had house prices of over a million dollars. In fact, you could buy a property in Manhattan, New York, for less than you could in Moranbah.
Investors pushed the market to breaking point by inflating rents and taking on BHP/BMA’s tolerance level of paying excessive rents.
Today an online search sees properties back at a much more affordable level of around $500,000 and rents back at about 5%.
Of course, most markets don’t suffer massive highs and rapid lows. Most markets battle away and perform with no boom-or-bust pattern. Most well-balanced regions with diverse economies tend to inflate and deflate yet still rise in value. This has been shown consistently, and the current property average is 10.4% yearly growth, measured over 100 years.
Remember that 80% of buyers purchase real estate way too late in the cycle. If the masses are buying, shrewd owners are selling. The marketplace is made up of many emotions, and you need to understand them to understand sentiment.
Understanding investor psychology
The table below shows the psychology of the market, from optimism to capitulation, all the way through to relief and hope. As you can see, the market is a mixed bag of ups and downs.
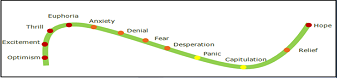
If you start to truly understand the market and comprehend its psychology, you can make fabulous money. Most people buy when the market is ‘thrilled’ or ‘euphoric’.
This is when the market has risen as much as it’s going to and the chance to make massive profits has already passed. You can make more money in ‘panicking’ or ‘capitulated’ markets where there are a lot of cheap properties for sale.
Understanding property cycles
History tells us a property market’s cycle lasts for 10 years. During this time it expands and contracts, and starts its cycle again.
A great example of this can be seen in the Perth property market’s 10-year data.
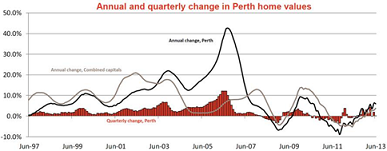
Perth’s last market normal was in 2003, and its new market normal is in 2013. Normal is the start of the cycle. In 2006/7 we saw the past peak of the market. The next six years saw a market that was deflating. Now, in 2013, we can see the rise again, 10 years on.
The easiest way to understand property cycles is to use a property clock. If you use a normal analogue clock you can reference where we are in a cycle.
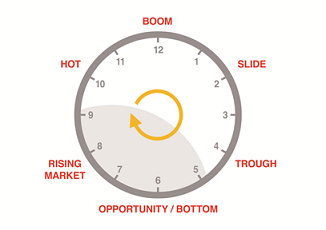
The clock has hands; we use the hands to determine where we are in the cycle.
The peak is at 12, and 6 o’clock is the bottom.
‘Slide’ sits at 2 o’clock, which follows a market high and is when the market begins to cool.
A good sign that a market is in the ‘slide’ period is that values are beginning to slow by 5–10%. This period normally lasts about a year; however, at this point people are in denial about the market’s viability. Don’t be afraid to leave the market at this time, even though everyone else appears to be sticking it out. Otherwise known as the start of the slowdown, this usually goes on for a year and is accompanied by denial as a sentiment condition.
‘Trough’ sits at 4 o’clock and is easily recognised as a falling market. At this point, fear and desperation permeate the marketplace, with values floating above the CPI (Consumer Price Index) at a 3–4% growth rate.
It can take up to five years to work through this cycle, but if you’ve been watching the markets you won’t have to worry about this stage. Sometimes people assume the market has ‘bottomed out’ and will buy in this stage although the market has further to fall. In what is otherwise known as a general slowdown, approaching the bottom, the market psychology is fear and desperation.
‘Bottom’ of the market is at 6 o’clock – a great time to buy! This time on the property clock is often referred to as an ‘opportunity market’ as it is easy to buy at a discount from panicked sellers. The corresponding psychology is capitulation.
When a market has hit rock bottom, it will be sitting still. There will be a small volume of sales and lots of great opportunities to achieve discounts from desperate vendors. At this point the market sentiment is one of resignation, which normally lasts about a year.
This does represent a great time to buy, and for those investors willing to gamble that the bottom really has arrived, it’s possible to achieve amazing results. However, as investors we typically try to catch the market as it’s starting to rise, coming off the bottom.
The ‘Rising’ market is at 8 o’clock – the absolute best time to buy for most novice investors. While buying at 6 o’clock is great for discounts, often in a rising market valuers are still looking to the past for data and will value the houses even lower, and because the market is actually rising you can realise your profit a lot faster.
To do this we keep an eye on capital growth in the area, even drilling down to the suburbs, looking for a solid 2.5% growth per quarter, totalling 10% in a year’s time. This is a strong indicator that the market is moving in the right direction. This period lasts anywhere from one to three years. Once the market has achieved its first 5–10% growth in the first year, we know this is a great time to buy.
Otherwise known as the start of recovery and a rising market, the market indicators are easy to read and they point towards growth, which is already happening with more certain to follow. This generally lasts for three years, and the feelings are of hope and optimism.
Signs of a rising market:
- Interstate investors investing in the area (will push prices up)
- Auction clearance rates in excess of 50%
- Local investors beginning to return to the market
The market is ‘Hot’ at 10 o’clock and should be avoided for property purchases. Prices will be shooting up quickly, which is great if you have a property in the market, but it means that the demand is high and people will be scrambling to get a property.
This is when people are willing to negotiate a lot higher than the asking price. Also known as approaching peak, the expansion has occurred and all buyers are believers. This is a fantastic market for selling but a poor one for buying. It lasts for about a year, and the psychology is excitement and thrill.
Signs of a hot market, which typically lasts about a year:
- Everyone is excited and talking about the area
- Time on the market is very short
- Vendors consistently receive their asking price, or even more
BOOM is at 12, which means you should not be buying, but it’s is a great time to sell. Obvious signs of a boom are lots of interest from the media and rampant growth for three years in a row. Otherwise known as market peak, this is the ceiling on market growth within any normal cycle. Its length is roughly six months and its corresponding psychology is euphoria.
Always remember: The A-class buyers buy at the bottom of the market. B-class buyers buy in a rising market and C-class buyers buy at the top of the market. The A-class buyers sell to the C-class buyers, and the C-class buyers take the 12 o’clock to 5 o’clock loss in the market.
Therefore, you should buy between 5 o’clock and 9 o’clock on the property clock, as anything outside of this isn’t a wise investment.
What are the worst things you can do in a hot market?
If you’re canny and experienced you can make money no matter what the market is doing, but investors will always make more by running counter to the cycle. The worst thing you can do is buy a property in a hot or peaking market. You are too late.
What are the worst things you can do in a falling market?
The worst thing you can do in a falling market is panic and sell your property at a loss. If you can, wait it out until the next cycle. Try to always sell in a booming market to maximise your results.
Once the market shifts, what are the telltale signs of change that investors need to know?
There are a number of markers to be aware of when considering the condition of a marketplace to identify the tipping point:
- Everyone is talking about investing in “XX” market. Sentiment is at an all-time high so people are caught off guard when news of the market’s imminent demise becomes evident. Because of this, individuals will be slow to react, denying that there is anything wrong.
- Valuations will begin to change as major valuation companies revise their opinions of the suburb or town, negatively impacting the liquidity of the marketplace.
- Buyers will be unable to find lenders mortgage insurers willing to lend in the area, severely limiting their borrowing options and ruling out 90% lending.
- Banks will require higher deposits as loan-to-value ratios (LVRs) drop to as low as 70%.
- Fear grips the market, causing valuations to drop further.
- Investors who bought into a marketplace early enough will have the chance to sell and still make a profit at this time, whereas many who purchased late in the game will be forced to hold on to their investments or sell at a loss to minimise the damage.
- Sales to locals will diminish.
- It’s very hard to sell and you can become trapped in the asset, as it’s no longer a liquid asset.
Though the market has cycles in various states and territories, Australia is also one market. As a whole, it’s doing very well.
Here is why the Australian market is doing well by world standards:
- Chronic undersupply
- Tight rental markets and growing returns
- Immigration and the emergence of a fast-growing population
- High home-ownership aspiration for all Australians, which is still achievable
- High-income financial society with a cultural prestige to be in property
- Investor magnet for yields and growth locally and internationally, particularly with Asian buyers
- Bricks-and-mortar security, and safe for investment (proved during the GFC)
- Preferential tax treatment through gearing
- Australia has a prudential financial environment and AAA banking
- Emergence of SMSF is putting pressure on supply and creating a new demand
Understanding where the market cycle is should be in every investor’s checklist. If it’s too hard to monitor, just follow the work of property experts and data providers. Here are three well-travelled data providers to consider:
- APM Monitors
- RP Data
- Residex
What is normal market behaviour?
The term ‘normal market behaviour’ is relative. What may be normal for one market is most certainly not normal for another. This is where market data comes into play.
As you study a market, pay close attention to all of the important drivers, particularly supply and demand and economics. For example, our larger cities – with high demand and a constant strain on supply due to lack of land – normally experience the most solid growth and sustainable prices. This is where you’ll find higher rents as market conditions push them higher. Wage growth versus house prices is also a smart way of assessing a market’s ability to grow. The best way to determine this is to consider that if wages can’t afford higher house prices, then property values may not be able to grow at all.
Affordable zones
Markets have four affordable zones:
Bearable market
A market is considered bearable if the demographics of the area are able to easily afford the local property prices.
Equitable market
This is measured in terms of the market’s ability to bear the cost of a property. For example, if a seller wished to remove his equity in his home by selling, would he be able to do so? If yes, then the market is equitable.
Sustainable market
A market that is sustainable will be growing at a fairly steady rate – not so quickly that values exceed the ability of the area demographic to afford housing.
Viable market
If all of the above requirements are met, then a market is considered to be a viable choice for property investors.
What’s considered an abnormal market?
When you look at a market’s performance over time, you’ll notice a trend. Year-after-year double-digit growth – while fantastic to experience – is not considered typical.
This particular kind of growth can always be attributed to an event or a series of events that are outside the norm; for example, at the beginning of a mining boom – this is where the majority of growth will happen as construction is undertaken and individuals move into the location with the lure of high-paying jobs. Higher-paying jobs then lead to higher rents because the market will bear the increase.
As time goes on, the market – including rents – will continue to grow, however at a more sustainable level. The diagram below is a good way to gauge infrastructure or mining areas that get artificially accelerated or decelerated based on infrastructure and projects spend. This graph is a way to gauge a mining market cycle.
No matter what the market is doing, you can still make money in real estate. But as investors we should all pinpoint where we are in the cycle, which will help us predict what may happen next for a better and well-planned outcome. Markets aren’t crystal balls, but we can make informed decisions by acknowledging where we are in the cycle.
Sam Saggers is CEO of Positive Real Estate Group. He has brokered more than a billion dollars in real estate deals and is a passionate educator. He has also written several books on property investment and has just released his latest book, Property Success in 7 Lessons: The Safe Way to Fast Track Big $