Not every property statistic carries the same weight of importance for every investor. Yield, for example, is of particular interest to those whose cash flow is tight. But what about renovation flips, small developments, low-risk buy and holds, etc.? How does an investor quickly identify those property markets that are most suitable for their chosen strategy?
There are too many different strategies to examine each one in detail in this article, so I’ll only cover the more common ones.
Top down vs bottom up
Many investors look for their next investment property using what I call the ‘bottom up’ approach. Somehow a property comes to their attention in a random kind of way. A friend, family member or colleague will say, “Have you seen what they’ve done with the industrial site out at Wherever Heights?” or “I noticed that old place on the corner is for sale”. Or maybe they’ll read a review somewhere about a specific suburb that will pique their interest.
Once the investor has the name of the suburb, they start their research by examining that market for whatever detail they believe is relevant. I call this approach ‘bottom up’ for a couple of reasons. One reason can’t be published because it contains another word for ‘bottom’! Another reason is that the investor is starting off somewhat randomly by analysing whatever comes to their attention.
The bottom-up approach has no systematic way of covering all markets and filtering out the bad ones. As a result, the investor may never find out about the best opportunities out there. Only a small number of locations come to our attention in this random manner. But there are literally thousands of suburbs around the country – 15,000 to be precise.
Conversely, the ‘top down’ approach starts with the entire Australian property market and drills down into specific markets by filtering out those less likely to suit our goals. This way the chances of missing a truly excellent opportunity are slimmer.
In this article, I’ve listed a number of suburbs for each of the more common strategies. Your Investment Property regularly publishes this list. You can also try an online web app such as boomapp.com.au.
Cash Flow
To make a successful cash flow positive investment, you need a property with a good yield, of course. Investing in a location where the yield is pretty high makes it easier to find an individual property among all those that might meet your cash flow criteria. For example, it’s a lot easier to find a property with a yield of 8% in a market where yields are typically 6% than it is in markets where yields are typically only 4%.
How to research the market
- Check the yield
The yield should be your first port of call when looking for high cash flow investment locations. Although each property will have different income and expenses characteristics, the market as a whole will influence the property’s cash flow. Checking the yield for a market is an easy way to narrow down your search for the right property.
- Check the price chart
Yields can get pretty high in markets with falling dwelling values. But you don’t want to buy there. So you can’t simply look at the yield in isolation. Check that the market hasn’t been sliding downwards over the last few years by viewing a price chart.
- Check the vacancy rates
Even if rents haven’t changed, you don’t have to worry about yield figures dropping, so long as vacancy rates are low or heading even lower. Once vacancy rates drop to less than 1.5%, you should see yields start to rise as renters get desperate and landlords start to cash in.
- Check the recent change in rents
It’s also wise to check the change in rents over the last 12 months or more. Ideally, you want to see growth in rents over 12 months of 10% or more. This indicates a market on the move.
- Check the competition
The proportion of renters to owner-occupiers shows you how many other investors own property in the market. You want a low proportion of investors to owner-occupiers so there is less competition for tenants.
Table 1 consists of a list of property markets around the country that have a decent gross yield, low vacancy rates, and low competition from other investors. I’ve tried to share the love a little by listing the top three markets in each state.
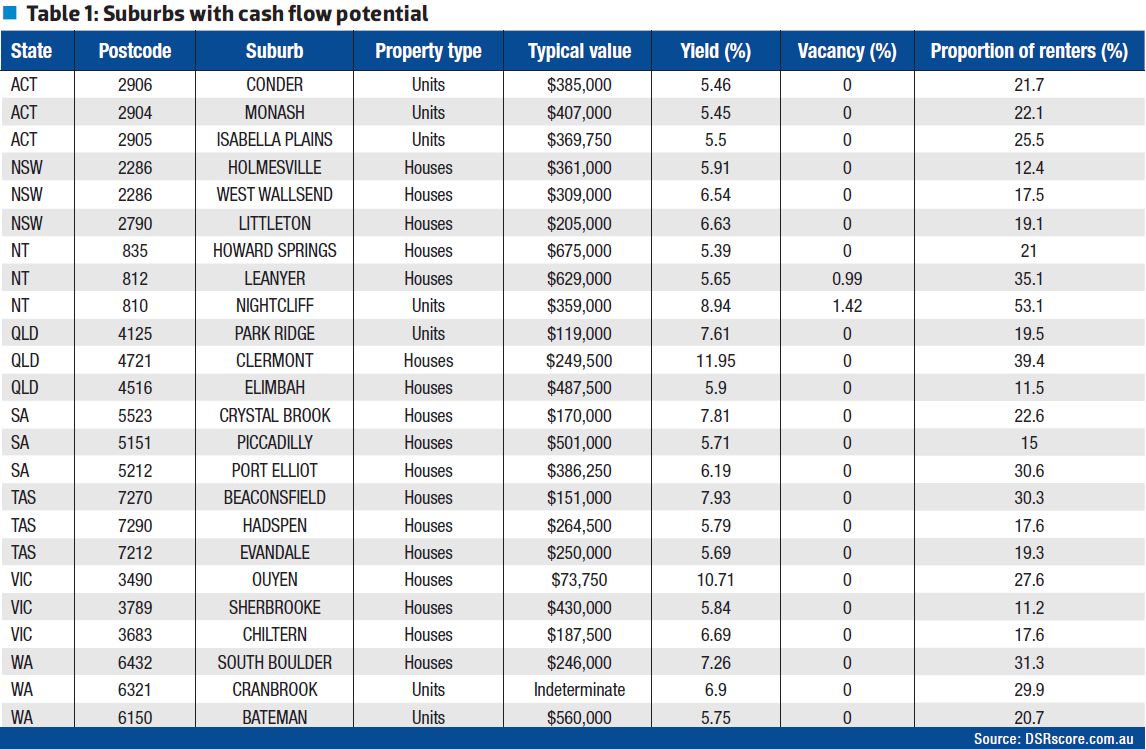
Table 1: Suburbs with Cash Flow Potential (Click to enlarge)
Warning
Yield is one of those statistics that suffers the most from anomalies – it is the least trustworthy. The problem is that yield is derived from two other statistics that are already pretty hard to gauge accurately.
Here’s how it happens. Let’s say you have a suburb with some classy property and some not so classy property. The low end may have $300,000 houses renting for $300 per week. The high end may have $500,000 houses renting for $500 per week.
Sometimes you get a glut of cheap houses selling for a month, and the median is therefore quite low for houses for that month. But at the same time in the same suburb there may be a lot of houses available for rent in the high end of the market.
So you may be calculating yield based on $500 per week properties that would never sell for as little as $300,000, and so the yield is inaccurate.
There’s a simple check you can do. Jump onto one of the property listing portals and compare like with like. Look at the type and quality of properties for sale and compare their prices to those of similar properties for rent.
It’s a slow method, but it has to be done to verify yield figures. Remember that the stats are used to highlight markets worthy of in-depth research. This is where the in-depth research starts – confirming the stats.
Next steps
If all the stats look good, the next step is to perform some fundamental research. This is the really subjective and time-consuming research. There’s a lot to it and no room to explain it all here. But you can’t think your job is done simply by looking at the stats alone. Check out the local economy and what is planned for the future. The council website is a great place to start.
Keep in mind that the net yield is much more important than the gross yield. So after finding the right market there is some homework to be done in order to identify the right property in that market. You have to calculate the net yield considering:
- rent
- interest
- insurance for houses or strata fees for units
- council rates
- property management fees
- lost rent due to periods of vacancy
- letting fees
- repairs and maintenance
- land tax (not usually applicable for beginners)
Most of these details are pretty easy to figure out – the ‘guestimates’ won’t deviate much from the ‘actuals’.
Growth
Capital growth is all about the imbalance between supply and demand. If the demand for property exceeds supply, then property prices go up. It’s a pretty simple concept and there’s a pretty simple way of finding markets that may be imbalanced in this respect: the Demand to Supply Ratio (or DSR for short).
The DSR is a single figure combining a number of stats to produce an overall indicator (a figure out of 48) of the demand and supply characteristics of a property market in Australia. The stats used to make up the DSR include data such as auction clearance rates, vacancy rates, stock on market, and so on.
How to research the market
- Check days on market
This is the number of days a property is listed before selling. The smaller the number the more demand there is, since properties are snapped up quickly.
- Check level of vendor discounting
This is the difference between the original asking price and the eventual sale price. Smaller discounts mean sellers don’t need to negotiate, since demand is strong.
- Check the auction clearance rate
Not all properties sell at auction, but they do in a market where demand exceeds supply.
- Check the proportion of renters to owner-occupiers
The fewer properties owned by landlords, the lower the supply of rental accommodation will be. So the smaller this figure the better.
- Check the yield
The higher the better, but make sure that it’s not due to falling values.
- Check the vacancy rate
Check out how many rental properties are vacant and how long they’ve been on the market. The lower this number the better.
- Gauge the stock on market
The percentage of stock available represents the supply. Tight supply leads to price growth.
- Look at the online search interest
This is the number of people searching for the number of properties available. The higher this number the better.
Table 2 provides a list of markets likely to be in a situation where demand exceeds supply, that is where the DSR ratio is high. Remember, the DSR is scored out of 48. The top three suburbs in each state are listed. For brevity, not all the DSR statistics are shown. You can see the rest on DSRscore.com.au, along with an explanation of what each statistic means.
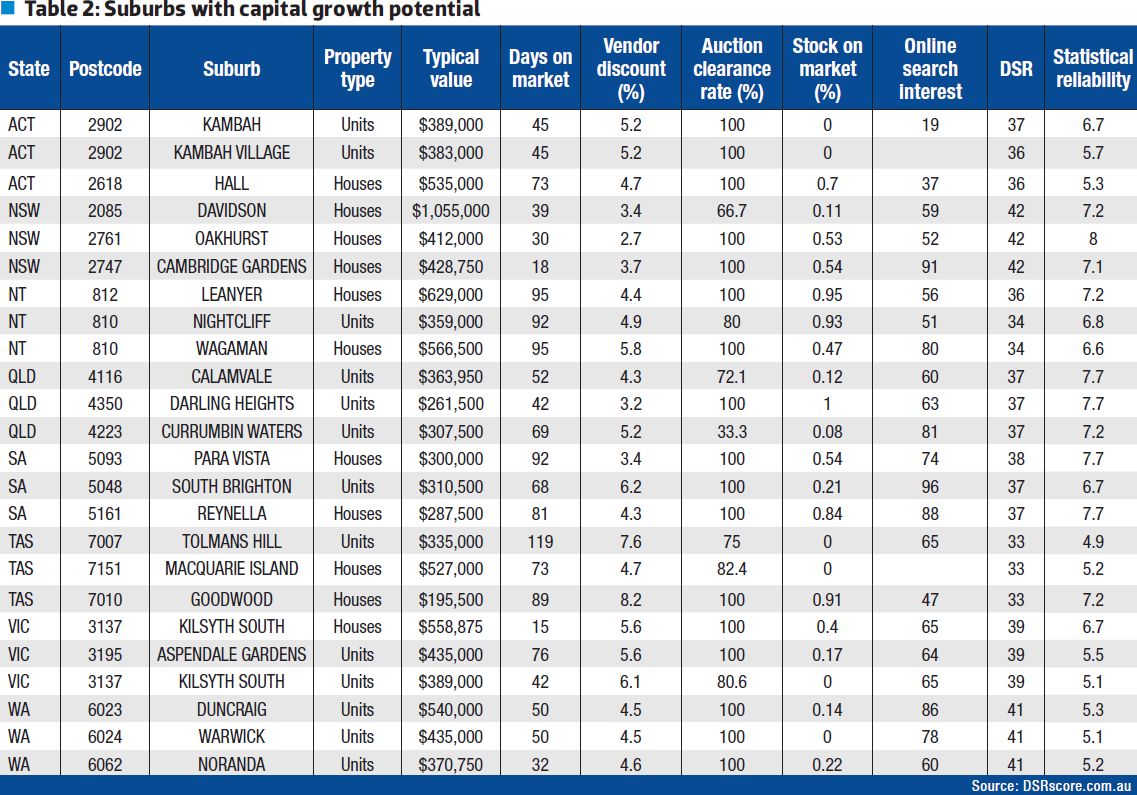
Table 2: Suburbs with Capital Growth Potential (Click to enlarge)
Next steps
Since the DSR uses quite a few stats, they all need to have anomalies in order for the DSR to get out of whack. That is unlikely. But even if it does happen, the statistical reliability (SR) figure gives you a ‘heads up’.
The SR is a score out of 8. Anything with an SR of 6 or higher is pretty reliable. As you can see, the DSR is pretty reliable for most of the markets in Table 2. Tolmans Hill in Tassie is the lowest, with 4.9 out of 8. There are a few others in the low fives you might want to treat with some caution.
As was the case with the cash flow strategy, you now need to perform the fundamental research for the growth markets. Key drivers of growth would be infrastructure projects (public spending) as well as private spending such as a new Woolworths or Bunnings opening up. There’s a lot more to it though; you could write a whole book on this topic alone!
Reno flips
A renovation flip is where you buy a property, renovate it quickly and then sell it. The renovation adds value to the property beyond the costs of buying, renovating and selling.
How to research the market
- Check days on market
Once you’ve renovated your property, you want it sold as quickly as possible so you’re not left holding it and paying interest while it is vacant. So a low figure for days on market is a good place to start with the stats.
- Check the auction clearance rate
The auction clearance rate (ACR) will indicate the demand for property with respect to supply. Nicely renovated properties may have a scarcity factor, making them suitable for selling at auction. You don’t want to do reno flips in a market that has a weak ACR.
- Check renter proportion
In markets where the proportion of renters to owner-occupiers is low, you find that properties are kept in better condition. They often have mod cons like pools and decks for entertaining. They are also well landscaped, since tenants don’t usually want to bother with that sort of thing. So renovating in a high owner-occupier market reduces the chances of overcapitalising. Look for the smallest proportion of renters to maximise your chances of success.
- Check the stock on market
The stock on market percentage is the number of properties for sale as a percentage of the properties in the area. This should be a low figure in good markets. The less supply the more chance of growth. You don’t want to be in competition with other sellers when selling your renovated property.
- Look for wide typical price range
If you can find a market where houses sell for anywhere from, say, $300,000 to $500,000, then you may find that you can buy a $300,000 house in this market and renovate it to look like a $500,000 house. Check online listings to see the difference between the lower and upper ends of the market. Then estimate the cost required to transform a lower-end property into an upper-end property.
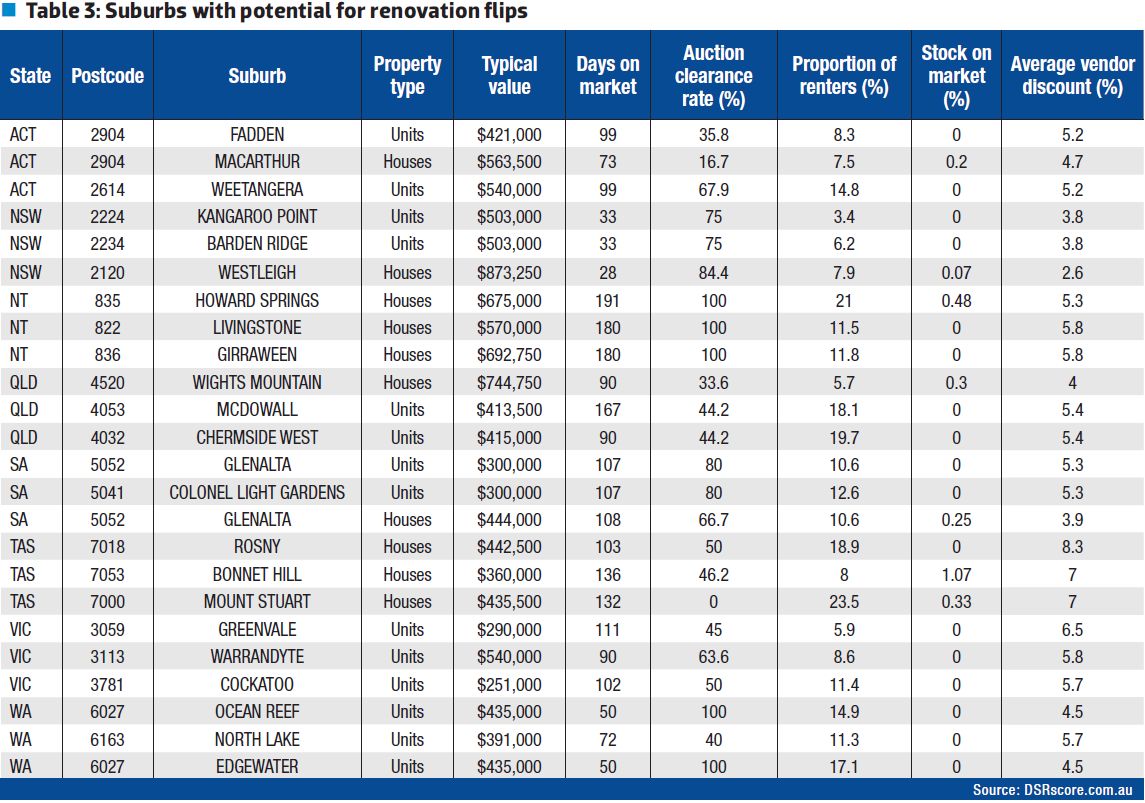
Table 3 lists some markets in each state with characteristics suitable for renovation flips.
Next steps
The next thing to do after verifying the stats is to find properties that do have renovation potential; properties that look dated, for example. There are many books and courses on this topic. I won’t dare to replicate that material here.
Low risk
Some investors are very risk averse. They may not care so much about glamorous growth in far-flung regions or crazy cash fl ow in two-bit towns. What is important to them is simply not making a mistake and therefore losing instead of gaining. They have two major concerns:
- Preservation of capital
- Persistence of income
How to research the market
- Check vacancies
You don’t want to have a property untenanted for long periods, especially if cash flow is tight. So make sure vacancy rates are low.
- Check the stock on market
Many people were burned when they bought on the Gold Coast a decade ago. The problem was oversupply. Too many developers built too many apartments, and there was too much to choose from so prices tumbled. Many of those investors would not have lost tens of thousands of dollars if they had simply checked the stock on market.
You want the stock on market figure to be as low as possible. If there are pages and pages of properties listed for sale in the area, and it’s a small area, then that spells trouble. You want a market you have to fight hard to get into, not one with loads of choices.
- Check recent price growth
Some markets may have buyers fighting over limited stock and sellers licking their lips. This sounds like a recipe for capital growth. And usually it is. But it can end abruptly if buying becomes ‘frenzied’. A few Sydney suburbs may have already classified themselves as frenzied this year. A typical symptom is when buyers make offers above the asking price.
If buyers have seen prices grow quickly in their chosen market, they may be in a rush to get in before prices climb beyond their budget. Eventually the prices will be too high for anyone to consider them good value, and the growth will stop. More often than not, the growth simply slows as demand subdues. But in some cases the growth stops dead and can even back up a little when a bit more reason enters the minds of buyers.
The easy solution is to check recent price growth charts. If there has been a massive and sudden climb in values, you may be looking at a market in frenzy. Similarly, if prices have been falling, you may also want to give it a miss. The ‘Goldilocks’ price chart is either a flat line for the last five or more years, or one showing moderate growth of less than 8% per year in the same timeframe.
- It’s not sexy in the city
Growth and yield may not be so sexy in the city, but the city is a safer investment. Economic diversity is vital for a safe investment, and cities have loads of it. If you invest in any of the top 50 cities in Australia, that should be safe enough.
Table 4 contains a list of some low-risk markets in each state. Note that they all have zero vacancy and stock on market percentages.
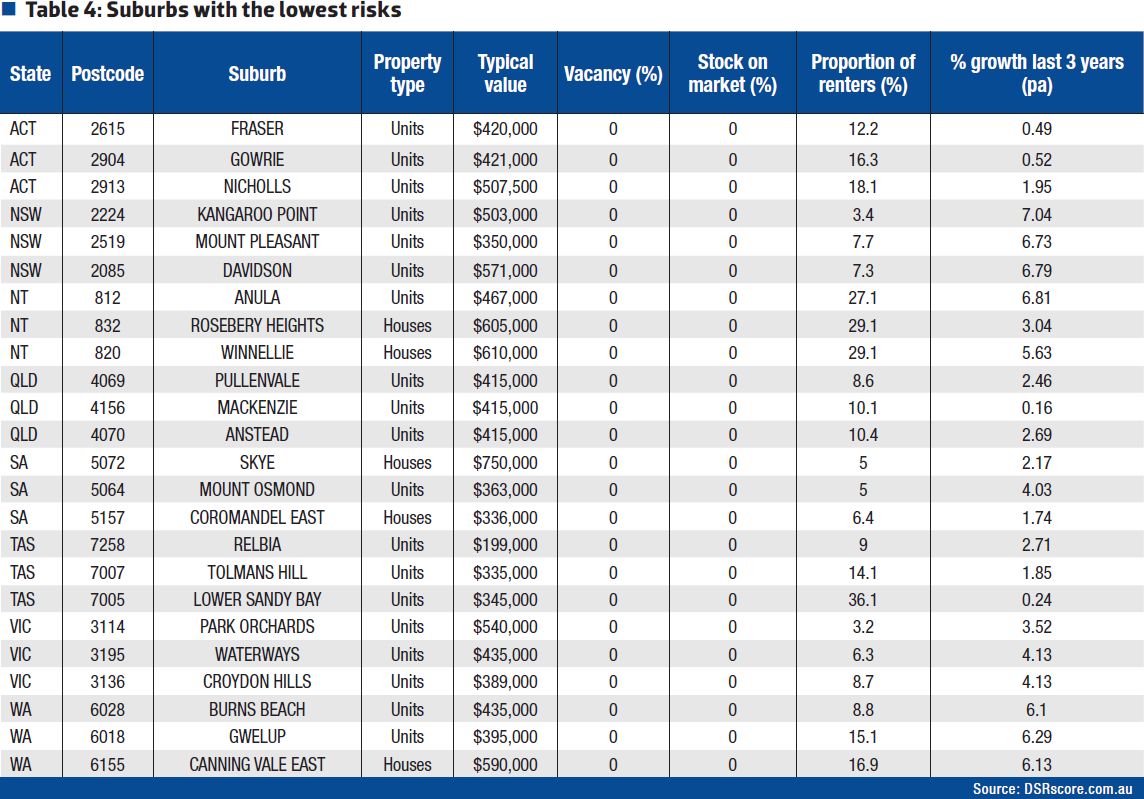
Table 4: Suburbs with Lowest Risks (Click to enlarge)
Next steps
Check the local council website to see what new developments have been planned. You don’t want a massive new estate opening up or apartment blocks rising like cliff faces on either side of the main street. A skyline of cranes is a dead giveaway that something is being built. But is it residential?
Jeremy Sheppard is an active property investor, and creator of the DSR Score (DSRdata.com.au), which measures the capital growth potential of markets based on the balance of property supply to demand.
This feature is from Your Investment Property Issue #88. Buy the copy to read more!