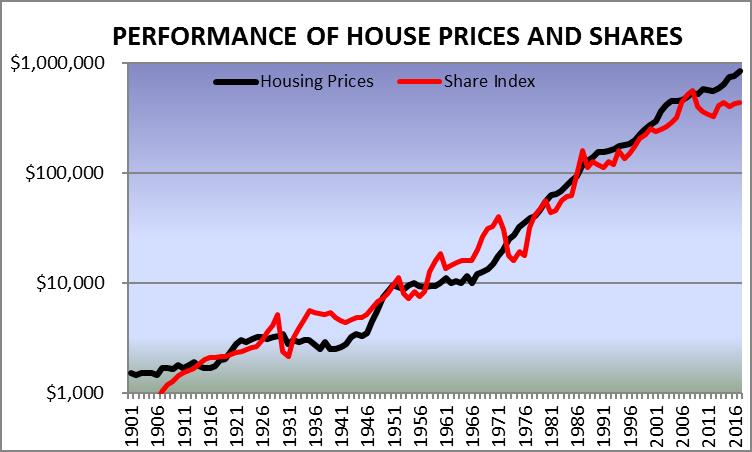
When we compare the performance of shares and housing over the history of our nation we can see some interesting similarities, but also some crucial differences. The graph shows how each has performed since 1901 using a common index so that we can easily compare the critical changes that have taken place over the years.
The performance of shares since the GFC
Back in 2007 the performance of both shares and housing was about the same and then share prices took a massive hit in February 2008 from which they have yet to recover. At first glance, this might lead you to think that shares are an undervalued asset compared to housing as the red line in the graph (Share Index) is further below the black line (Housing Prices) than it has ever been. Now could well be the right time to ‘buy when there’s blood in the streets” as Baron Rothschild said. But before we sell everything else to buy shares, there are several other ways to interpret the data. It could just as well mean that housing price are about to fall, rather than shares rising, or it may mean that we shouldn’t rely on past performance to indicate WHAT might change in the future. What past performance can tell us is WHY these changes occur and it is our understanding of the causes that will help us to make the right investment decisions at the best time.
Why do share markets perform as they do?
The cause of the share price fall in 2008 was fear – it was a time of great uncertainty, with many experts predicting a world-wide recession and even a breakdown of the entire financial system. Shares can be quickly traded and as more and more were sold, fear turned to panic and the fall became a collapse. The graph shows that this has happened several times in the past, when the red line took a sudden downwards turn as shares prices fell. They were:
• 1929 – The arrival of the Great Depression
• 1952 – The start of the Korean War
• 1960 – The Menzies Government Credit Squeeze
• 1974 – The ‘petrodollar’ crisis and Stagflation
• 1990 – The recession “We had to have”
• 2008 – The onset of the GFC
These events had social, economic, financial and political causes and while some were initiated locally, others were international. What they had in common was the loss of investor confidence they created, leading to large share sell offs. Each time, the price of shares fell quickly and then took years to recover. Shares are for when the world is having a party, not when it is facing a potential disaster.
The performance of housing during the Great Depression
If you look again at the graph you will notice that during those crisis periods, Australian housing prices did not behave the same way as shares. In fact, the only noticeable effects that any of these events has had on housing prices were a small dip on 2009- 2010 after the GFC and a much larger but more gradual decline in housing prices during the Great Depression. It is this latter period that we can use to benchmark possible future falls in housing prices.
The Great Depression lasted from 1930 until the onset of the Second World War and during this time housing finance was virtually unobtainable. New householders had to rent while many existing homeowners lost their homes as unemployment rose to 25%. Yet our population kept growing and so the demand for housing as accommodation continued. Rents rose until they took 50% of average household income and reached an incredible 25% rental yield. At the same time, the percentage of home ownership dropped to less than 50%. Housing prices fell by a total of 26% from 1930 to 1937 which is about 5% per year, even though this was the worst economic period in our history. Such events are highly unlikely to ever occur again, but they do prompt the question – why did the housing market fail to crash?
Why so housing markets perform as they do?
The reason is that over three quarters of our housing is owned by, or being paid off by owner occupiers, not investors. Most people buy a home, not an investment and they trade affordability against facilities, location, security and status. They have no interest in rental yields and little appreciation of capital growth other than the belief that housing prices go up over time. Even under the most severe conditions, home owners will do almost anything to retain their home, especially if they have lived there for a few years. They’ll take a worse job, find a second job, look for any way of generating more income. They’ll cut household expenditure to the bone, even go cap in hand and borrow from family. On the other hand, under more normal conditions, they sell when their family needs change, moving to a bigger home in a better location, or to a smaller home in a retirement destination. They don’t sell to obtain a quick profit, or to avoid a potential loss.
This is the main reason housing performs differently – most property buyers and sellers are not in it to win it, but to live in it. This puts you at a distinct advantage as an investor, because when householders from one area to another they create changes in supply and demand that you can anticipate and take advantage of. No matter how the housing market is performing, your performance as an property investor should always be considerably better and this is why you should sleep soundly every night.
.................................................
 John Lindeman is widely respected as one of Australia's leading property market analysts, authors and commentators.
Visit Lindeman Reports for more information.
He has well over fifteen years’ experience researching the nature and dynamics of the housing market at major data analysts.
John’s monthly column on housing market research featured in Australian Property Investor Magazine for over five years. He is a regular contributor to Your Investment Property Magazine and other property investment publications and e-newsletters such as Kevin Turners Real Estate Talk, Michael Yardney’s Property Update and Alan Kohler’s Eureka Report.
John also authored the landmark books for property investors, Mastering the Australian Housing Market, and Unlocking the Property Market, both published by Wileys.
To read more articles by John Lindeman, click here
Disclaimer: while due care is taken, the viewpoints expressed by contributors do not necessarily reflect the opinions of Your Investment Property.
