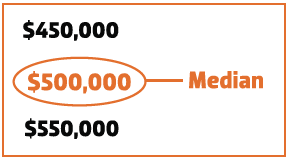
The median is the middle figure of a set of figures when placed in order. So if three houses sell, the middle price is the median...
 Medians can be deceptive
Imagine a sleepy little regional town with old two-bedroom fibro shacks
on small blocks that were perhaps built 60 years ago. They may sell for
$200,000 every now and then. Here is what the sale prices might look like in January of a typical year:
$200,000
$200,000
$200,000
The median in this case would, of course, be $200,000.
Now imagine a developer recognises the area as having some profit potential since the presiding council is amenable to new developments. The developer clears some land and creates large, fully landscaped blocks with double brick, 4-bedroom, double-storey houses with 2-bathrooms and double lock-up garages. Since these new houses are so much better than the old houses, they sell for a lot more. Let's say they sell for $400,000. So you might see in the next month the following sales figures...
$200,000
$200,000
$400,000
$400,000
$400,000
You can see that there were two sales of the old, cheap houses and three sales of the new, expensive houses. The median, being the middle figure, is now $400,000. Last month, the median was only $200,000.
So the median is now double that of the prior month. Typically, this would be published as 100% capital growth in one month!
Actually, there has been no capital growth at all in either type of housing stock – new or old. Old properties still sold for $200,000 and new ones for
$400,000. All that has happened is the median has shifted upwards because of heavy developer activity.
Median growth is not capital growth in this case.
'New' is usually more expensive than 'old'. And developers are under pressure to sell off their new stock quickly and get some money flowing in.
The urgency to sell can result in more new stock selling than old stock for some months, which causes the median to jump. Once the urgency has passed, the median can drop again just as quickly.
Why are there differing medians?
Median prices are published by a number of data providers: CoreLogic RP Data, Australian Property Monitors, On The House, the Real Estate Institute of Australia, Australian Bureau of Statistics and more. They each take
a different approach to a number of topics, resulting in different medians.
Different treatment of sales volume
Some data providers won’t publish a median if there have been too few sales, since it is considered statistically unreliable. But how many is ‘too’ many? Every provider may have a different opinion.
Some data providers take the approach that ‘the median is the median’ even if there was only one sale. So they publish whatever they have. And in the event there were no sales, some providers may simply publish the last recorded median.
Different treatment of odd cases
Some data providers may be smart enough to exclude sales if they suspect those sales were not ‘at arm’s length’. For example, there may have been a deal struck with family or an exchange of other goods or services not reflected in the price. We’re not talking hairy cheques here, but maybe a business was included in the sale, too.
Some providers may take a clever approach if the property sold was out of context, like a 10-hectare property with a single old knock-down house on it. That is more a sale of land than it is a sale of house.
Different treatment of area
When calculating the median for a large area like a city, some suburbs may be considered in the metropolitan area by some data providers, while others exclude them. Without a formal or up-to-date list, it is easy to get a slight difference.
Different treatment of property classification
To calculate the median for houses as opposed to units, a data provider needs to classify property types that don’t neatly fit into one bucket. What would you class the following – house or unit?
• 2-bedroom terrace
• 2-bedroom townhouse
• 4-bedroom townhouse
• 4-bedroom penthouse apartment
• 2-bedroom house on 250 square metres
• villa
• 1-bedroom unit above a retail shop on one title
Each provider will interpret property types like those above differently. This means each provider will come up with a different median.
Different treatment of date
To calculate the median for one month, it’s possible a data provider will consider the auction, or even contract date. But most will only take the settlement date. The point is, their date of consideration may vary.
And some providers may receive and publish this data at different times to one another. If the provider wants to release very current data, they might try to publish on the first of each month. But what if details of a transaction that took place on the 31st only arrive on the 2nd of the following month?Another provider may wait longer and include more late-arriving data for greater accuracy. But this would come at the cost of publishing later.
As you can see, there are many variations to the data set considered and in the calculations. So there can be many different reported medians.
Example of misleading medians
I delved into the DSRdata.com.au database to find some median madness. I was looking for suburbs in which medians had risen by 100% or more in the last six months.
By ignoring the sales volume and statistical reliability and just focusing purely on medians, I found 14 property markets out of about 30,000 in total that matched these criteria.
See 'Misleading medians' table below for the 14 markets I found. The changes in median price range from 102% to a whopping 169%.
Misleading medians
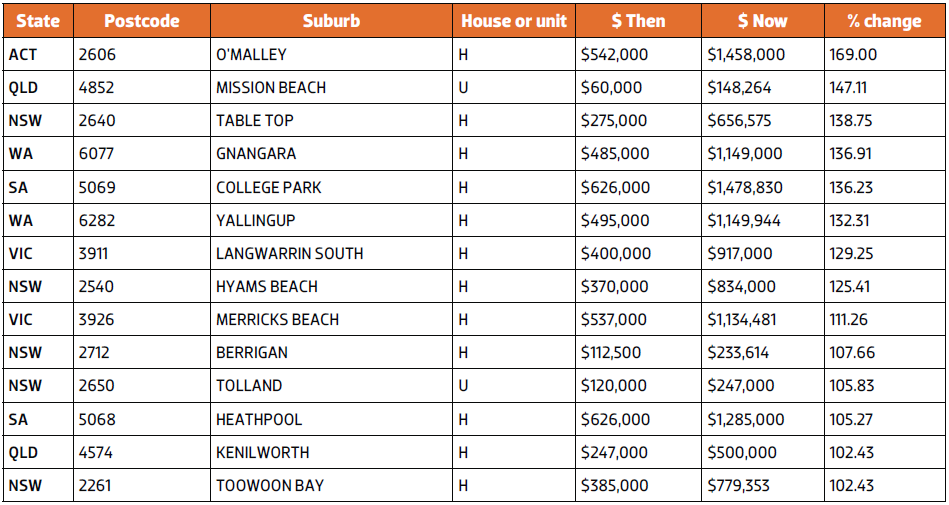
O’Malley had 14 houses for sale when I checked in mid-August. Asking prices ranged from $1.5m to $2.8m. So you can see how sale prices could easily vary by 100% right now!
In August 2015, Mission Beach’s unit market consisted of 1-bedroom units with an asking price around the $150,000 mark. But 2-bedroom units were often commanding well over $300,000.
Bedroom count can be a large factor in determining price. Depending on which type of unit was most commonly traded in a month, a median unit price in Mission Beach could easily double in value one month and then halve the next.
Quality of finish is another factor. In January 2015, Table Top in NSW had four houses listed for sale. Although one was a 6-bedroom house, the other three were 4-bedders. These three ranged from $440,000 to $850,000 in asking price. There were five houses for sale in August 2015. Asking prices again ranged wildly from $375,000 to over a million dollars!
You can see that from month to month, prices can vary in some markets by as much as 100%. A six-month period may have very little to do with it.
These markets may not have experienced any capital growth at all in these six months. The Demand to Supply Ratio (DSR) for Table Top houses, for example, was only 50 out of 100 in January. This is below average for Australia at that time. See the following graphic.
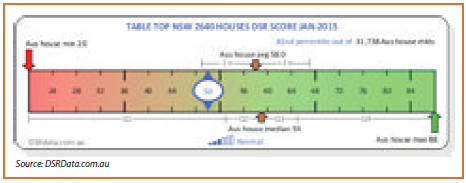
The DSR is a score of demand relative to supply, used to try and gauge capital growth potential.
Mission Beach’s unit market had a DSR of 28 out of 100. That’s one of the lowest DSR scores in the country. This is a market in which an investor should expect negative capital growth since there is very little pressure on prices to rise. But the change in medians suggested growth over 100%. It’s simply not true.
Big price ranges
From the examples shown previously, you can see that a lot of median growth anomalies occur in markets in which there is a considerable range in prices. Some investors are attracted to such locations for renovation opportunities. If they can renovate a $300,000 house to make it look like a $500,000 house, then there is potential for significant profit.
Following is a list of the top 10 property markets in the country at the end of July 2015 in terms of listing price deviation.
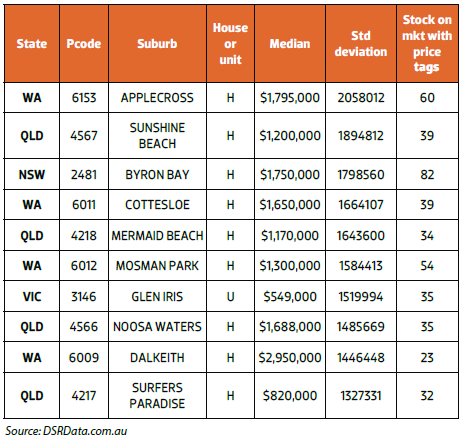 Only property markets with more than 20 listings at the time were considered. The results were ordered by Standard Deviation. The standard deviation is a statistical calculation that shows the amount by which a set of figures varied.
In almost every case, the standard deviation differed by an amount greater than the median itself. That means medians could double one month and halve the next depending on what happened to be trading during that month.
You can see that the list of suburbs is dominated by the unaffordable ones. They’re also dominated by locations that have the lure of resort or holiday lifestyles. They may also have a significant involvement from developers. All these factors can heavily influence the range of prices and therefore the median.
Can investors use medians?
Investors could be tempted to use high growth anomalous medians like the list shown to find markets ripe for renovation. But there are better indicators for finding renovation hotspots. So an examination of the median is not much help in this case.
And as we’ve seen, medians can’t be relied on to calculate capital growth. So no help there, either.
Ideally, the median is used to find markets that suit your budget. But as can be seen from the prior examples, this may not work out as planned, either. There could easily be properties that fit into your budget in markets in which the median is out of your budget.
So what good are medians to investors?
Medians can be used for all of the above, but only if the medians are not suffering from anomalies.
How can you tell?
One manual way to tell is to jump on realestate.com.au and have a look at the variety of properties for sale and for rent. Look at their locations and asking prices, quality of finishes, age, style, orientation, etc. If there is a significant difference between the type of properties, then expect significant difference in price, and therefore possibly an anomalous median.
If the features of properties in an area are fairly consistent or at least don’t waver to extremes, then you can expect the median to be reasonably reliable.
The volume of sales helps, too. The more sales that are considered in a median calculation, the more likely the median will be reliable. If there are only a dozen properties for sale currently, then the turnover of stock is unlikely to give an accurate median.
Conclusion
We’re all guilty of swallowing a figure and never questioning its reliability. Unfortunately, if you’re relying on the median to make informed investment decisions, you’re going to have to do some time-consuming research. But don’t think it isn’t worth it. Good ‘intell’ is everything in this game. Don’t trust those tricky medians.
