There has been a bit of discussion about Queensland being the primary state to experience the next surge in Australian property prices. There has even been the suggestion that the Gold Coast may be returning to its former glory.
Here, we take a look at the Upper Coomera unit market on the Gold Coast to see what changes are taking place on a statistical level and gauge the potential of a particular development opportunity.
Most of the research I’m about to explain can be done by you for your own markets of interest, using a few key online data resources... and they’re free.
What caused the Gold Coast downturn?
The Gold Coast was once a haven for ever-increasing numbers of retirees, tourists and anyone looking for a holiday lifestyle. They found the Gold Coast irresistible. Developers saw an opportunity to make a buck off the back of chilling baby boomers. In no time, the Gold Coast skyline took off like a backyard lawn after summer rain. The result was an oversupply of units. When supply exceeds demand in any market, prices inevitably fall.
Quite often, investors and small-time developers focus too much on the demand side of the equation and treat supply as the poor cousin. Experienced large-scale developers don’t make this schoolboy error, but their projects can take several years to complete. Within that timeframe, many novice developers can flood the market, ruining what was once a highly-promising project.
Some mid-scale developers are now looking at doing numerous small projects rather than single large projects. Not only does the diversification of location lower risk, but also the shorter timeframes mean there is less chance of a market turning south during construction.
Investors looking to buy off the plan can lower their risk by aiming to buy into smaller projects that have shorter timeframes. For units, look for a block of no more than 50 units. For townhouses, anything less than a dozen in the block should be a safer option. Gold Coast lesson learnt? Not really – a new mug is born every minute! The Melbourne CBD and Gladstone in particular are awash with oversupply. This problem of developer overreaction is unlikely to ever go away.
Investors need to be vigilant, keeping an eye on the stats of every market they currently own property in and those they intend to own property in. Don’t let high demand suck you in; remember to examine supply as well.
Is Upper Coomera due for an upturn?
Upper Coomera is on the northern edge of the Gold Coast, about a third of the way to Brisbane. The Upper Coomera market is dominated by houses. Units and townhouses are thinly traded. In late January 2014, there were more blocks of vacant land for sale than there were units and townhouses combined. This is a cause for concern for investors since it is possible for developers to easily add extra supply.
However, the vacant land may not be zoned for unit or townhouse development. Perhaps it is largely zoned for houses or commercial premises. It is up to the investor to check out which areas of interest to them are zoned for medium or high density. You can direct enquiries to the City of Gold Coast Council. Their website has a great deal of information available. A low count of units doesn’t necessarily mean there is no demand for them. Actually, it can mean there is an undersupply, since not everyone wants to live in a house. This represents an opportunity for investors if it is the case. Let’s look at the stats to see what they suggest about the demand and supply of units in Upper Coomera. Is this market about to turn?
Demand to supply ratio
The concept of key concern for an investor is what is the demand to supply ratio (DSR). We want it to be as high as possible if we’re chasing capital growth. The DSR score for Upper Coomera units for the last four years is shown in Figure 1.
The DSR score looks at multiple statistics, such as auction clearance rates, renters versus owner-occupiers, days (a property is) on market, rental yields, vacancy rates, and many other statistics, some of which appear in the Upper Coomera analysis following. The DSR score is a single number, which indicates a suburb’s likelihood of achieving imminent capital growth and therefore may identify a good place to invest. This score has proven invaluable, by historically pinpointing the top 33% of property hotspots with 96% accuracy. See www.DSRscore.com.au for more detail.

From Figure 1 you can see that it looks like the balance between demand and supply bottomed out around the middle of 2011. Since then, there has been some volatility, but the DSR score is definitely on the rise. Right now it is at a point we consider to be ‘balanced’ – that is, the demand for and supply of units seem to be in a state of balance. At this point in time, you’d expect prices to rise in line with the long-term national average. If the DSR score rises higher, you could expect prices to rise above the rate of the long-term national average.
Typical unit values
The value of units in Upper Coomera has been on a downward trend for quite some time, as Figure 2 shows.
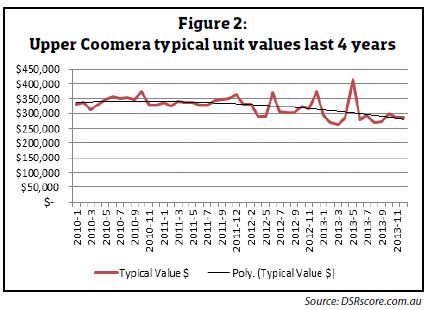
Given that the DSR score is a lead indicator, this downward trend in prices should start to turn around soon. It is currently possible for investors to pick up a unit in Upper Coomera for under $300,000. Although it is very hard to pick the bottom of a cycle until it has passed, the changes in the DSR score suggest this is about to take place.
Days on market
Days on market (DOM) is the number of days it takes for a property to sell, on average, once placed on the market. Figure 3 shows the DOM for units in Upper Coomera over
the last four years.
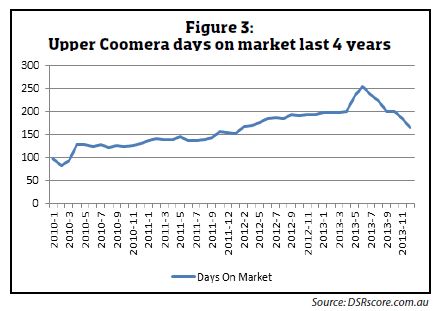
Note that something happened to turn the market around in mid-2013. Since then, the DOM has been dropping rapidly. A ‘decent’ DOM would be around 100 days. At the end of 2013, the average DOM Australia-wide was about 160 days and the median was 145 days. Upper Coomera units were averaging 164 days on the market before selling. So there is some way to go before investors will have to make quick decisions. But all that could change in 2014. Watch this stat over the first few months of 2014.
Discounting
The discount is the difference between the original asking price and the eventual sale price in percentage terms. A balanced market has in the past typically been around 5–6%. However, the average for Australia at the end of 2013 was 7.9%, and the median was 7.5%. Upper Coomera finished 2013 off with a discount of about 7.2%. But what is impressive is the direction in which the discount figures are clearly trending (see Figure 4).
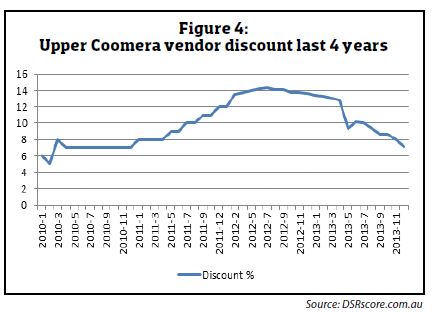
In the middle of 2012, the vendor discount figure reached its peak. This is when vendors were trying their hardest to attract buyers. With a turnaround in the DSR, this figure has been steadily dropping.
Vacancy rates
With such a thinly traded market, the vacancy rates are going to be very volatile. This is clearly seen in Figure 5. But a trend is clear among all the wild swings.
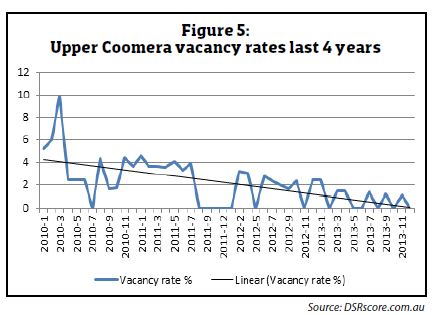
To me, a vacancy rate of 0% is one of the best early indicators of the potential for high yields and capital growth to follow. According to this chart, vacancy rates can’t get much lower. Early 2014 will probably be the best point in the last five years for this statistic in the Upper Coomera unit market.
Yield
Again, because the unit market is thinly traded in Upper Coomera, the yield shown in Figure 6 is quite volatile.
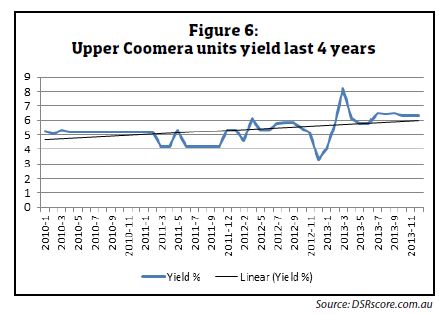
The yield is particularly hard to accurately determine because statistical anomalies creep into both the median price and median rent, distorting figures potentially further than most other stats. You can have a rental market comprising of three-bedroom luxury apartments, yet most of the sales may be happening in the low-end two-bedroom portion of the market. Although the trend line shows an increase, the volatility is too extreme to draw any genuine conclusion. However, there is some suggestion that the yield can be quite attractive for some units in Upper Coomera.
A yield of 6% as suggested by the chart is certainly a breaking point for tenants. They won’t want to keep paying more in rent than they would in mortgage interest if they owned. This is why a high yield is likely to place pressure on prices – that and the interest of investors in cash flow positive property.
Percentage stock on market
The stock on market percentage (SOM%) doesn’t show any trends, so I won’t show a chart. Suffice to say it has been a consistently good figure for the last few years. The SOM% for Upper Coomera units for December 2013 was 0.05%. This is “Very good”. This market placed in the 36th percentile for the country, ordered by SOM% out of a total of 12,982 markets with adequate SOM% data at the time. The median SOM% for December 2013 was 0.58% and the average was 1.14%. So clearly this market is undersupplied in terms of units. The next question is whether there has been demand for units.
Online search interest
The online search interest (OSI) is the number of people searching for property online compared to the number of properties available for sale at the same time.
The OSI for Upper Coomera for December 2013 was six searches per property for sale. This is “Very poor”. This market placed in the 77th percentile for the country, ordered by OSI out of a total of 12,641 markets with adequate OSI data at the time. The median OSI for the same period was 13 searches per property for sale, and the average was 22.1 searches per property for sale. So interest in buying a property in Upper Coomera is currently quite weak.
However, the OSI is based on any type of property, not specifically units. The search interest for units may be proportionally better than for houses. Remember that the Upper Coomera market is dominated by houses rather than units. So only a couple of people searching for units would make the unit OSI acceptable.
Interested investors can contact local real estate agents and ask if there is much interest in units from renters or buyers. This will give a clearer gauge of the likely vacancy rate and pressure on prices.
Statistical reliability
The statistical reliability for Upper Coomera units for December 2013 was scored as “Highly reliable”. You can check out all these figures at the back of this magazine or online at boomapp.com.au.
Recommendation
My recommendation to investors is:“The Upper Coomera unit market is an acceptable market to invest in, more so if a suitable strategy is applied. If buying to hold, confirm that fundamental drivers are likely to increase demand and/or decrease supply further”.
This market may fly under the radar of most investors searching by DSR score. However, the rapid change in some of the key statistics makes this a turnaround market to keep an eye on in 2014.
Jeremy Sheppard is an active investor, creator and director of DSRscore.com.au.