Capital city home values saw a significant drop last month, despite the RBA’s interest rate cuts. And the picture over the past year is even more disappointing. But there are some reasons to be cheerful. Read on for analysis and city-by-city results.
According to the RP Data-Rismark Home Value Index for May, capital city home values dropped by -1.4% over the month, bringing the total drop over the past 12 months to a worrying -5.3%. So which cities were the worst affected?
Melbourne was the biggest loser over the month (-2.7%), followed by Darwin (-2.4%) and Perth. The only city to record a positive monthly result was Adelaide (1.2%).
Looking at the year-on-year picture, Adelaide once again recorded a positive score (1%), with Darwin (0.2%) being the only other city to record an annual price rise. Hobart was the worst annual performer (-8.9%), followed by Melbourne (-8.4%) and Brisbane (-6%). (Scroll down to see the full results).
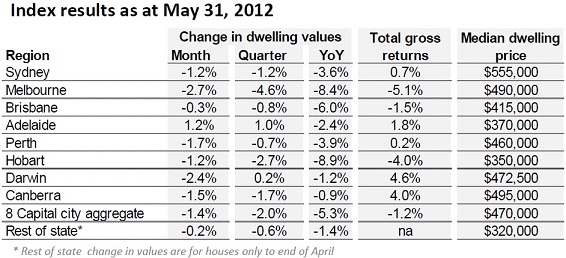
Source: RP Data-Rismark Home Value Index, May 2012
But the generally negative picture doesn’t account for all sectors of the market, says RP Data research director Tim Lawless, as detached housing has suffered more than units.
“It is clear that the market is becoming increasingly price point driven. Unit values across the combined capitals increased in May and they are up by 1.3% over the first five months of the year,” he said.
“Based on median prices, unit prices are generally around 15 to 20% lower than house prices. Investment yields also tend to be higher and units are often located more strategically compared with their detached counterparts.”
He added that, according to the RP Data-Rismark Stratified Hedonic Home Value Index, premium dwelling values have fallen by -6.1% over the 12 months to April, whereas dwelling values at the affordable end of the spectrum were down by just -1.5%.
But before you let the doom and gloom ruin your day, it’s worth noting that improved housing affordability is predicted to aid the property market’s comeback in the coming months.
“The combination of interest rate reductions, declining home values and disposable income growth has significantly improved affordability,” said Rismark managing director Ben Skilbeck. “Since dwelling values peaked in November 2010, they are down by -7.6%, the RBA cash rate has fallen from 4.75% to 3.75% and disposable income per household has increased by over 5%.”
Rising rental yields, too, offer property investors plenty of solace.
“Rental yields are higher now compared to a year ago across every capital city. In some cities where rents have increased meaningfully, such as Darwin and Perth, gross rental yields have improved by 50 basis points or more,” said Lawless, who added that there are plenty of signs that capital growth stability is en route. He noted the following reasons to be cheerful:
- Vendor discounting has reduced from a peak of -7.9% to -7.1%, which suggests that vendors are becoming more realistic about price expectations on their home.
- The average number of days it takes to sell a property has also fallen from the seasonal highs recorded earlier this year. The typical capital city house is now taking 63 days to sell compared with 70 days last month.
- Auction clearance rates have also levelled at around 50%, compared with an average of about 45% throughout the second half of 2011.
So what’s preventing the market from bouncing back? Skilbeck blames low consumer sentiment.
“Despite what appears to be a positive economic picture here in Australia, with unemployment below 5%, solid population growth and below average mortgage rates, the Westpac Melbourne Institute Index of Consumer Sentiment remains 6.3% below its long term average. Concurrently, new mortgage finance commitments aren’t moving a great deal, suggesting we are yet to see heightened buyer activity return to the market,” he said.
And the sheer number of homes currently on the market suggests that buyers still have the upper hand. According to RP Data estimates, there were approximately 308,500 homes advertised for sale across Australia during May, which is almost 9% more than at this time last year.
SQM Research puts the figure even higher at 369,225, but the stock on the market picture varies widely from city to city. Click here for the city-by-city breakdown.
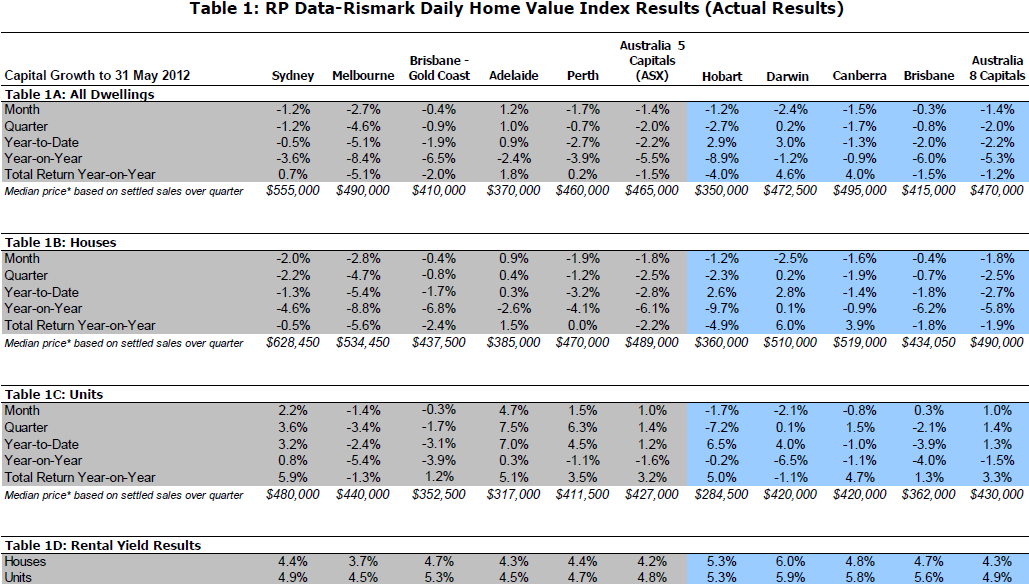
Source: RP Data-Rismark Home Value Index, May 2012
Is consumer sentiment the missing ingredient? Have your say by commenting below or joining the debate on our property investment forum.
More stories:
What does the RBA’s rate cut mean to you?
