
Australia’s house prices have fallen at the fastest quarterly pace in September, reflecting the impact of the successive rate hikes.
This was the major finding in Domain’s September 2022 House Price Report, which also pointed out that the downturn has continued to gather momentum and spread geographically.
Domain chief of research and economics Dr Nicola Powell said many buyers and sellers have never experienced in the current market conditions in their lifetime.
“The mix of interest rate hikes, strong inflation levels and high household debt has understandably had a significant impact on consumer sentiment,” she said.
“While prices are expected to continue to fall further, our data married with the current economic indicators show it is likely that the September quarter could be a peak quarterly decline.”
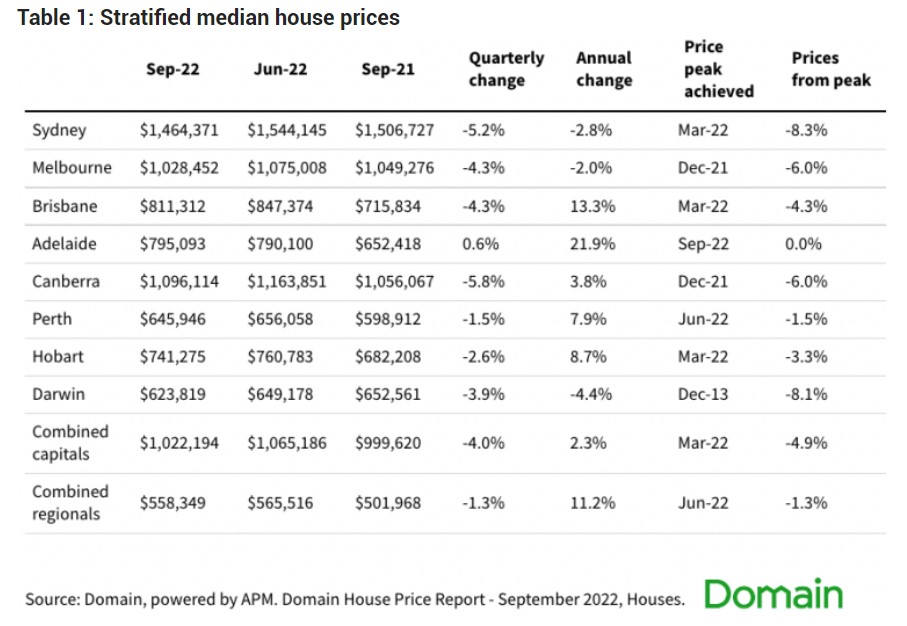
Over the quarter, combined capital cities reported a 4% quarterly decline. From their peak in March 2022, prices have already went down by 4.9%.
Despite these falls, it would still take a further 21.3% drop to erase all the growth seen during the pandemic boom
Dr Powell said the RBA started to ease the pace of rate hikes, which has helped shift the tone of what can be expected of the market for the rest of the year.
“With rising overseas migration and short-term visa holders returning, we should start to see an improvement in investment activity which, in time, will provide more rental opportunities,” she said.
“However, prospective buyers will continue to stick to a more conservative approach by forward planning for any further rate hikes and being mindful of their lower borrowing capacity.”
Here are the capital city highlights from the report:
Sydney
The city reported its fastest decline in house prices on record. However, house prices in Sydney are still substantially higher than what they were before the pandemic property boom.
Melbourne
Both house and unit markets in Melbourne posted their steepest quarterly decline in median price on record. This means that the city’s downturn has gathered significant momentum over the quarter.
Interestingly, Melbourne’s unit market reversed all the growth it recorded over the previous quarter.
Brisbane
Brisbane’s unit market bucked the overall downtrend, with prices maintaining their position from the previous quarter. However, the eased pace of growth suggests that the strongest upswing in Brisbane’s unit prices in around 14 years has already lost momentum.
Adelaide
Adelaide is the only capital city that reported gains in the quarter. However, the growth trend in the city continues to lose steam, as house price growth strike its slowest pace since 2020 while unit price gains hit its weakest rate this year.
Canberra
Similar to other bigger cities, Canberra’s property market gathered significant downside momentum during the quarter, recording the fastest decline in house prices on record.
Perth
Perth’s house prices have fallen from the last quarter’s record high — this significant turnaround for the city’s housing market stalled the upswing that pushed prices at their highest for the first time since 2014.
Hobart
Hobart’s house prices have declined for a second consecutive quarter in September — this is the first time that this has happened since 2014.
However, Hobart did record a gain in the unit market, reversing about half of the decline it recorded in the preceding quarter.
Darwin
Both house and unit prices were on a decline in Darwin, pulling back the growth achieved in the previous quarter. The declines in both markets were the steepest since the onset of the pandemic.
Median House Prices for September 2022 Quarter
—
Photo by ENiemela from Pixabay