Property investing is a tried and true means of wealth creation, but how does it compare to investing in shares?
Whether you choose to invest in one or the other - or perhaps both - one thing is certain –your results are nearly always better if you invest over the long term, rather than short term. While both investment avenues are prone to be affected by market fluctuations, the share markets tend to be - on the whole - more volatile than the property market.
Share Market Past Performance
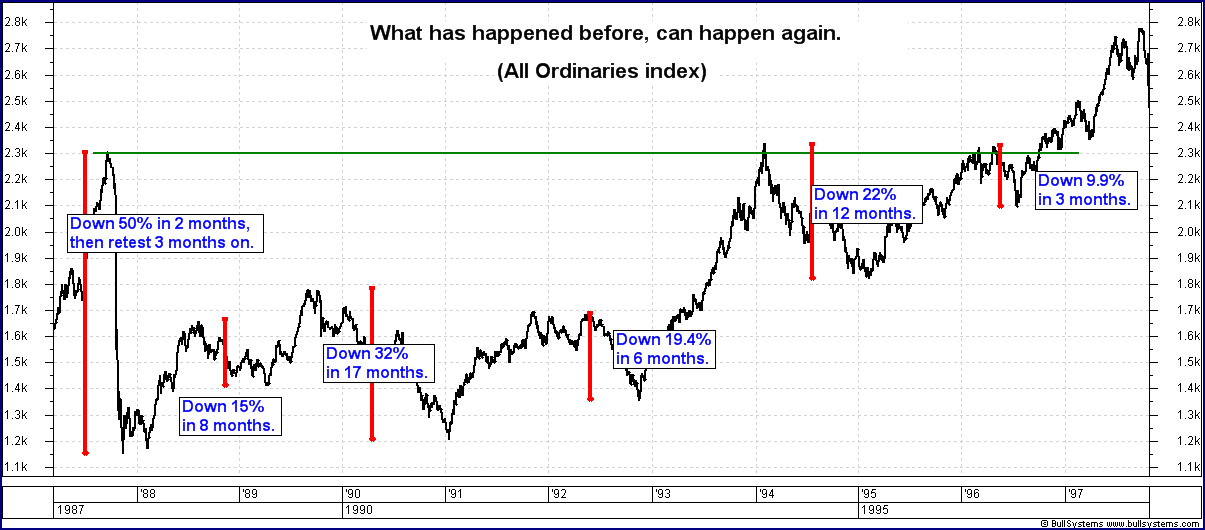
Let’s take a look at the XAO’s (Australia’s All Ordinaries Index) performance from 1987 to 1997.
Robert Brain, sharemarket analyst and share trader and National Director of the Australian Technical Analysts Association (ATTA) and VP of the Melbourne Chapter reveals why the share market is subject to what he calls the “herd mentality”.
“When contemplating what the future may bring to the markets it is useful to reflect on what has happened in the past,” says Brain.
To prove his point, Brain provides a chart showing Australia’s All Ordinaries Index (XAO) performance during the time just before the 1987 index crash up to 10 years later in 1997.
See the chart below.
Source: The December 2012 ASX Investor Update newsletter
As the chart reflects, after the 1987 crash, the index fell five more times by approximately 10% or more each time; with two of those times falling in excess of 20% (a/k/a bear market). So in summary, over the 10 year period indicated in this chart there were 3 bear markets (19.4%; 22%; and 32%) with 2 market corrections (15%; 9.9%).
Notes Brain, “Since our more recent market crash of 2008, where the All Ordinaries index fell 50 per cent and is still today 36 per cent below the 2007 highs, we have seen a number of share market falls greater than 10 per cent, and one of these greater than 20 per cent.”
“Whatever has happened before can happen again.” says Brain, “The Australian sharemarket might be able to rally strongly within the next couple of years, but this is not likely given the unresolved economic woes in Europe and the US, and the global markets’ interdependence.”
Brain believes that “we should not be surprised to see continued volatility in the charts” and has also noted that “it is possible that the Australian market will not make new sustained highs for about five more years.”
Given the recent history of the share markets, would you be comfortable placing your retirement completely in its grasp?
What was property doing during this time period? While there are a variety of things that can impact the property market (meaning property values can and do fluctuate) as a whole, property investing has proven to be a solid investment vehicle over the long term.
Property Market Past Performance
Take a look at the chart below, which reflects capital city property values over the same 10-year period.
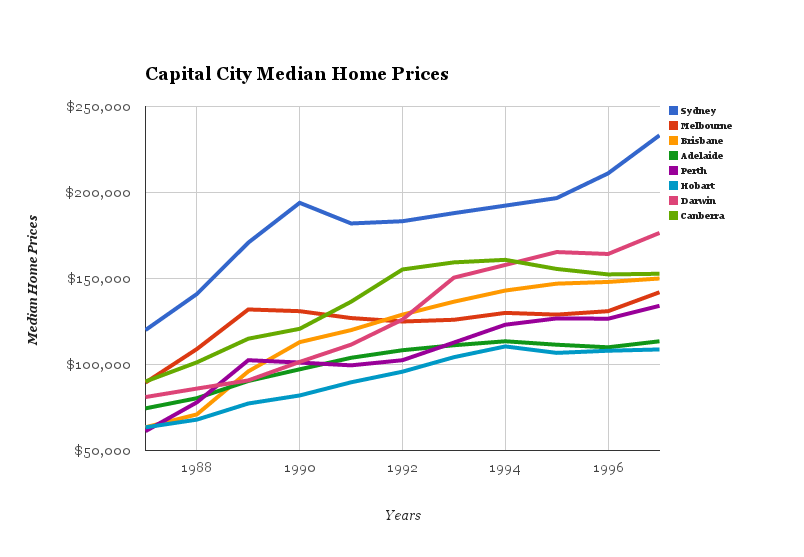
Data: HOUSING PRICES IN AUSTRALIA: 1970 TO 2003 by Peter Abelson and Demi Chung
As the chart clearly reflects, the overall trend of property values over the same time period tended to be fairly even. Despite a few bumps for many capital cities in the early 1990s all capital city home prices remained either stable or grew pretty consistently during the same time frame.
House prices tend to remain fairly stable, however even if they do fall, they never go down to nothing. You can lose everything you’ve put into the stock market and have nothing to show for your efforts, however even if your property’s value goes down, the cycle will always come back ‘round again, allowing you another chance to not only recoup your losses, but to perhaps gain even more.
Shares are influenced more quickly by economic changes than property. For example, BHP Billiton recently lost shares of 1.4%, which means shareholders lost money because BHP’s profits fell by 30% to $12B - a great deal lower than analysts were predicting.
Recent Property Market Performance
The following chart reflects the upward nature of house prices in Australia from 1998 through 2012.
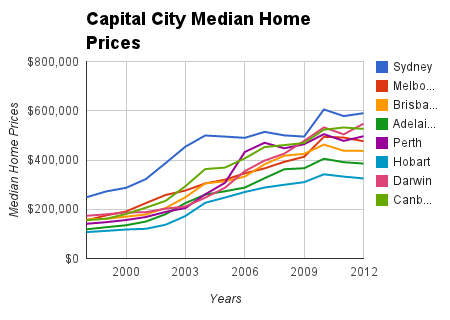
Source: ABS HOUSE PRICE INDEXES: EIGHT CAPITAL CITIES
Recent Share Performance
As mentioned previously, we can often gather evidence about possible market behaviour by taking a look at what has happened to the share markets previously.
It’s been proven over and over again that market extremes are a result of the opinions market participants have about the perceived value of the shares they are trading. It’s human behaviour and therefore past behaviour will continue to show itself in the markets.
Taking a short view, the following charts reflect trading on the ASX All Ords for a 1 year, 5 year and 10 year time frame.
1 year
Source: Shareswatch.com.au
5 years
Source: Shareswatch.com.au
10 years
Source: Shareswatch.com.au
Looking at the 1 year chart you might get excited to see trading reach or pass the 5000 mark, however a closer look at the 5 year time frame shows that it’s really not all that exciting - the market has seen this level before.
Greg Atkinson, editor of Shareswatch Australia and Managing Director of Ohori Capital stated in his article titled 2013 Federal Election, All Ordinaries & Stock Market Outlook, that “...the Australian stock market has essentially gone nowhere since late 2009.”
Finally, Atkinson’s 10 year chart lays it out in black and white. Investors who have owned shares are not keeping the short term gains they have acquired. Compare this to the chart above which reflects median housing values and you’ll see exactly why property beats out shares...every time!
Sam Saggers is CEO of Positive Real Estate and Head of the buyers agency which annually negotiates $250 million-plus in property. Sam's advice is sought-after by thousands of investors including many on BRW’s Rich 200 list. Additionally Sam is a published author and has completed over 2000 property deals in the past 15 years plus helped mentor over 2200 Australian investors to real estate success!
Get more from Sam Saggers, register for a FREE property investor night –
To read more Expert Advice articles by Sam Click Here
Disclaimer: while due care is taken, the viewpoints expressed by contributors do not necessarily reflect the opinions of Your Investment Property.