Expert Advice with Jeremy Sheppard
26/05/2015
Property prices move up when demand exceeds supply. So to gauge how likely a property market is to experience capital growth we need to determine the demand relative to supply, dah right?
I applied this concept to the eight state capital cities to calculate their demand to supply ratio. In fact, I’m specifically talking about the DSR+™ which combines the following 17 indicators of supply and demand:
- Days on market – quicker sales mean higher demand to supply
- Average vendor discount – lower discounts mean higher demand to supply
- Auction clearance rate – strong bidding means higher demand to supply
- Proportion of renters – lower renter count means less supply of rental accommodation
- Vacancy – lower vacancy means limited supply of rentals and plenty of tenants
- Yield – high yields mean strong demand from investors, needy tenants & good values
- Stock on market – low stock on market percentages mean limited supply
- Online search interest – lots of people looking online but limited properties available
- Market cycle timing – high recent price rises will subdue demand
- Neighbour price balancing – cheap suburbs beside expensive ones
- Ripple effect potential – recent growth among nearby suburbs may flow over
- Unit to house value comparison – which property type is under-valued relative to the other
- Long term growth – have recent price changes made property less affordable
- Percentage sales growth – has an increase in sales volume indicated a market on the move
- Percentage rental growth – increased rents indicate agile tenants moving in
- Percentage sales by auction – is demand strong enough to support sales by auction
- Percentage open for inspections – is demand strong enough to support OFIs
The DSR+ considers all the above statistics and combines them into a single score out of 100 to make estimating supply and demand using big data easy. See figure 1 for the demand to supply estimates for each of our capitals.
By the way, the 1st eight indicators, and a few more, are available for free at DSRdata.com.au.
Figure 1 – minimum, maximum and median DSR+ by capital city
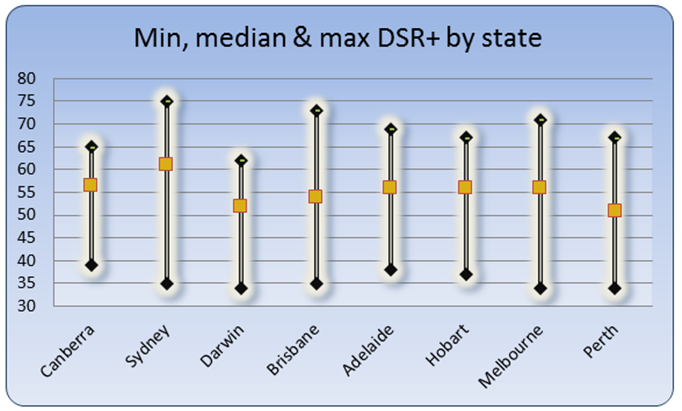
Source: DSRdata.com.au
To get figure 1, each suburb in the DSRdata.com.au database was scored by DSR+ for data up to the end of May 2015. This included unit and house markets within each suburb. The minimum DSR+ for each suburb within each city was determined as well as the maximum and median.
Note that Brisbane’s median DSR+ was 54. That was less than all other cities except for Darwin (52) and Perth (51). Sydney is still the best city for immediate capital growth potential as of May 2015 with a median DSR+ of 61. This is highlighted in figure 2.
Figure 2 – Sydney still to outperform Brisbane
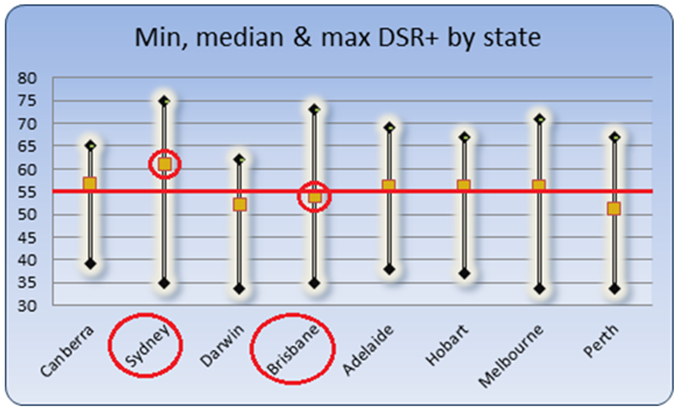
Source: DSRdata.com.au
But we’re looking at the wrong points
Figuring out which capital city will perform best over the next 12 months is something the big boys talk about all the time to show off their skills. What they’re really doing is highlighting how out of touch they are with investors.
Investors can’t buy a city. So we’re not interested in which one will perform best. We can only buy a property in a single suburb at a time. So what we really want to know is which micro-markets have the best demand to supply ratio. This is highlighted in figure 3 where the best opportunities are shown in red.
Figure 3 – Data points for investors not economists
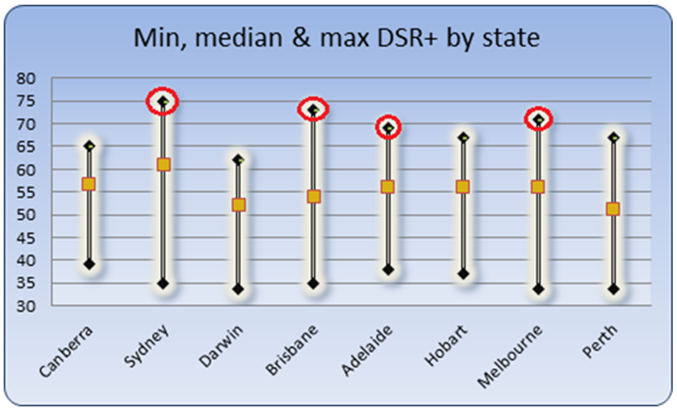
Source: DSRdata.com.au
Why would an investor buy in the median or average suburbs of a city? We want to buy in the best suburbs. The worst city for imminent capital growth is Perth with a median DSR+ of 51. But its best property market has a DSR+ of 67. That property market should outperform the Sydney median which has a DSR+ of 61.
So although Brisbane as a whole may not have the best capital growth prospects, it does have some of the best isolated opportunities. In fact, the best of Brisbane (DSR+ 73) is only 2nd to the best of Sydney (DSR+ 75).
Micro vs macro again
This concept of examining micro-market economics instead of macro markets to find the best investment opportunities can be taken a step further. Why are we restricting our examination to only capital cities and not regional markets too?
Again, this is because economists gather data for macro markets, so the usual conversation topic is which city will perform best. They either aren’t interested in what property investors are, or they simply don’t know what is relevant for us.
Finding the top markets in the country by DSR+ is a snack using the database at DSRdata.com.au. But since subscribers are charged a fee for this privilege, I can’t really give away a list of the top markets. It would annoy those who have already paid for that data.
But what I can do is tell you the top markets by basic DSR. That is, not by DSR+ which costs, but the simple DSR, which is free.
Interestingly, some of the best property markets in the country for immediate capital growth are not in our major capital cities. See table 1 for a list of some of the best.
Table 1 – some of the best property markets by DSR May 2015
| State | Post code | Suburb | Prop type | DSR |
| ACT | 2906 | BANKS | Units | 76 |
| NSW | 2262 | HALEKULANI | Houses | 87 |
| NT | 810 | NAKARA | Houses | 70 |
| QLD | 4008 | PINKENBA | Houses | 80 |
| SA | 5091 | BANKSIA PARK | Houses | 78 |
| TAS | 7054 | HOWDEN | Houses | 77 |
| VIC | 3786 | FERNY CREEK | Units | 84 |
| WA | 6077 | GNANGARA | Units | 81 |
Source: DSRdata.com.au
Conclusion
Don’t get caught up in the rhetoric about potential growth in our cities, it won’t help you make better investments. Instead, examine the micro-market at suburb level. This will be far more relevant for the street in which you find a potential property to buy.
Oh and for the record, Sydney is still going to kick Brisbane’s caboose this year - I’m not talking NRL.
....................................................................................
Jeremy Sheppard is the property data nut-job responsible for the DSR at DSRdata.com.au
Click Here to read more Expert Advice articles by Jeremy Sheppard
Disclaimer: while due care is taken, the viewpoints expressed by contributors do not necessarily reflect the opinions of Your Investment Property.