The rental markets across Australia’s capital cities have witnessed the biggest annual growth in April, driven by the surge in overseas migrants and international students and the fall in rental listings.
CoreLogic’s national dwelling rental index recorded an 11.7% annual growth across capital cities, the highest level on record. Overall, Australia’s rental index increased 0.8% monthly, 2.8% on a three-month basis, and 10.1% annually in April.
According to CoreLogic, the mismatch between the supply and demand continues to be the main driver pushing rents in capital cities.
In fact, the total supply of rental listings in capital cities was down 20.9% over the four weeks to April compared to the same period last year. Compared to the five-year average, rental listings were 39.8% lower.
This means that vacancy rates were also low — except in Hobart and Canberra. Vacancy rates across capital cities remained well below the 3% to 5% average.
Unit rents rising faster than house rents
The growth in unit rents continue to outpace that of house rents across capital cities — 1.6% versus 0.9%, respectively.
This trend was due to the continued preference for the unit sector among migrants and foreign students, who typically first settle in medium to high-density housing.
Sydney and Melbourne continue to record the strongest growth in unit rents across the capitals.
Over the month, both cities recorded a new peak rate of growth in both quarterly and annual trends.
Unit rents in Sydney increased 5.8% for the rolling quarter and 19.1% for the year to April.
Meanwhile, rents for Melbourne units went up 5.0% over the three-month basis and 15.2% over the year.
Momentum eases in regional markets
Across regional markets, momentum is clearly easing, as internal migration rates normalise and vacancy rates move off recent record lows.
Still, rents in regional markets increased, up 1.3% on a three-month basis and 6% over the year. This was down from a cyclical peak of 12.5% achieved in November 2021.
Over the month, regional South Australia reported the highest monthly rental increase at 1.1%, followed by regional Queensland and regional Western Australia at 0.6%.
|
Location |
April 2023 Median Rents ($) |
|
|
Houses |
Units |
|
|
Sydney |
756 |
663 |
|
Melbourne |
553 |
515 |
|
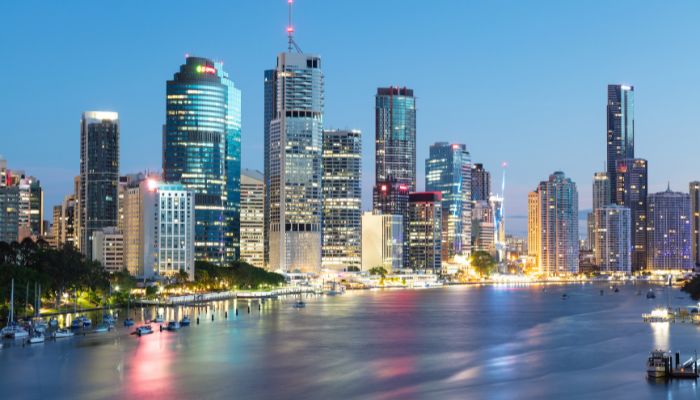
Brisbane |
630 |
533 |
|
Adelaide |
555 |
447 |
|
Perth |
592 |
516 |
|
Hobart |
578 |
501 |
|
Darwin |
650 |
504 |
|
Canberra |
715 |
586 |
|
Regional NSW |
565 |
491 |
|
Regional Vic |
457 |
365 |
|
Regional Qld |
572 |
583 |
|
Regional SA |
396 |
303 |
|
Regional WA |
498 |
490 |
|
Regional Tas |
449 |
367 |
|
Combined Capitals |
622 |
560 |
|
Combined Regionals |
515 |
494 |
|
National |
588 |
549 |
-
Photo by Veni on Canva.