In recent weeks several leading real estate bodies published detailed assessments of the COVID-19 impact on the Australian property market. The consensus is that, although the sales activity has significantly decreased, it is too early to conclude whether the property prices have been impacted. Based on current data, median prices remain steady despite the restrictions imposed on the real estate industry and the general recessional trends in the economy.
In this article, we will take a close look at the latest sales data in major Australian capital cities – Sydney, Melbourne, Brisbane, Adelaide, Perth and Canberra. We will establish the market trends before the spread of the pandemic early in the year and compare them to values reported in March, April and early May. These 3 months signify the introduction and subsequent easing of COVID-19 restrictions throughout the country. Therefore, analysis of property market data during this period, will provide us with a valuable insight into the impact of the pandemic on the Australian real estate market.
Introduction
HtAG® is a web portal for real estate professionals that assists its customers in making property-related decisions based on timely and actionable market information. We leverage the benefits of machine learning algorithms to rank the growth potential of different Local Government Areas and suburbs, Australia wide.
HtAG® collects Australian property market data via a Web Crawler which systematically browses major real estate portals & agent sites and indexes past sales, current listing and rental data. The data is then cleansed and analysed for key market trends to assist real estate professionals with market research.
The dataset used in this article is a subset of all the closed sales data collected in the period of September 2018 to April 2020. The data is segmented by 6 major capital cities – Sydney, Melbourne, Brisbane, Adelaide, Perth, Canberra. It does NOT contain data for rural areas outside of the city boundaries. Each sale is attributed to one of the 3 dwelling types: houses, units and townhouses.
The inspiration behind making this dataset public is to provide the raw sales data to the community to assist with analysis of COVID-19 impact on the Australian property market. Our data science team have prepared several graphs that will be used in this article to visualise property market trends in the timelines associated with the spread of the pandemic.
Before we deep dive into our assessment, let’s first visualise the dataset in the most simple way possible, a scatter plot with 2 variables: date of sale (x axis) and price (y axis).
Examining the scatter plots below, it is immediately evident that sales activity is vastly different in the 6 capital city markets. As expected, Sydney and Melbourne have the highest amount of sales recorded and a much wider price range than Brisbane, Adelaide, Canberra and Perth.
Melbournians love townhouses, which amount to a significant proportion of sales in the city. In contrast to that, townhouse sales are almost non-existent in Perth and Adelaide. Dwelling type data in Sydney, Brisbane and Canberra is relatively well-balanced across houses, units and townhouses which are marked green, red and blue on the chart.
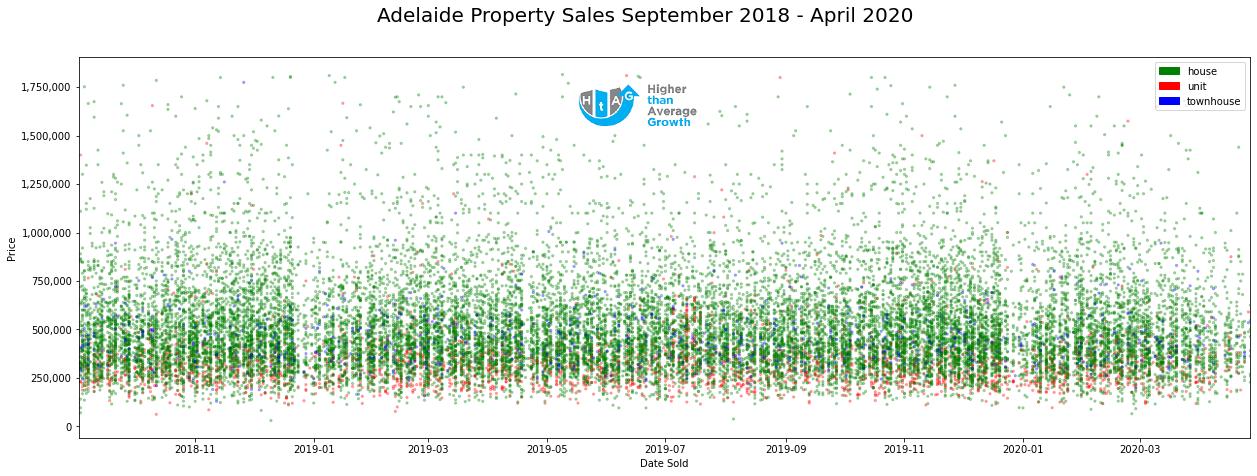
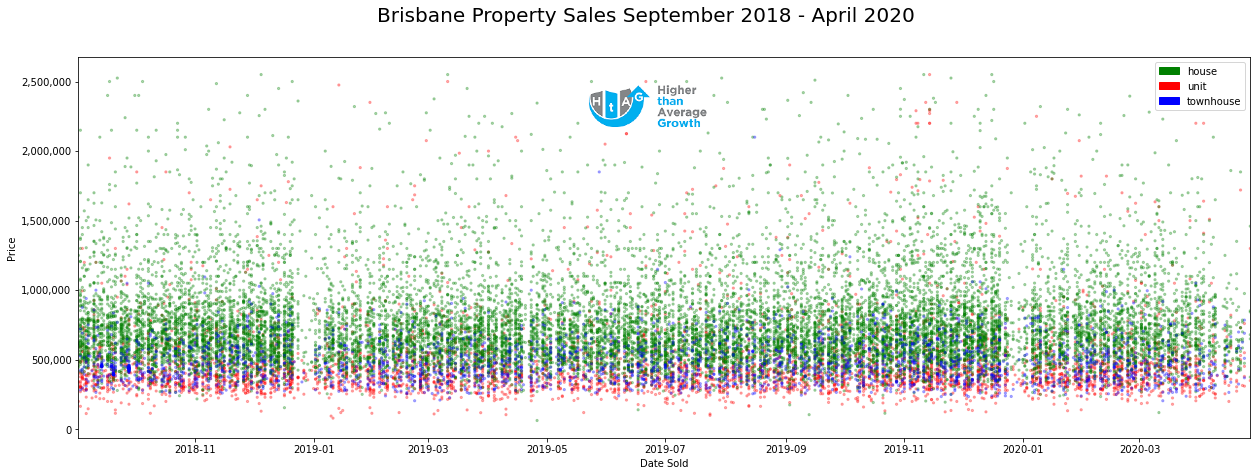
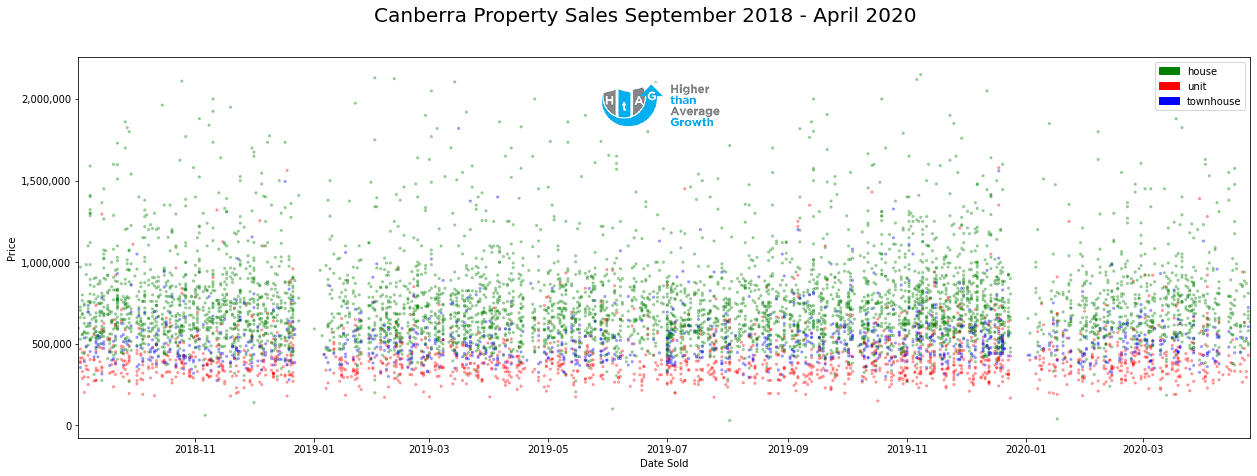
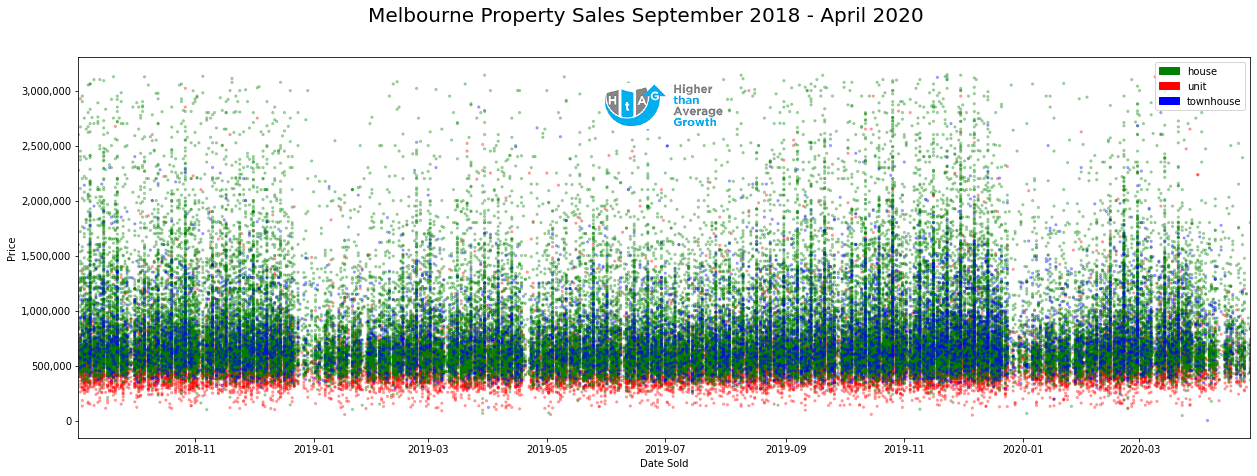
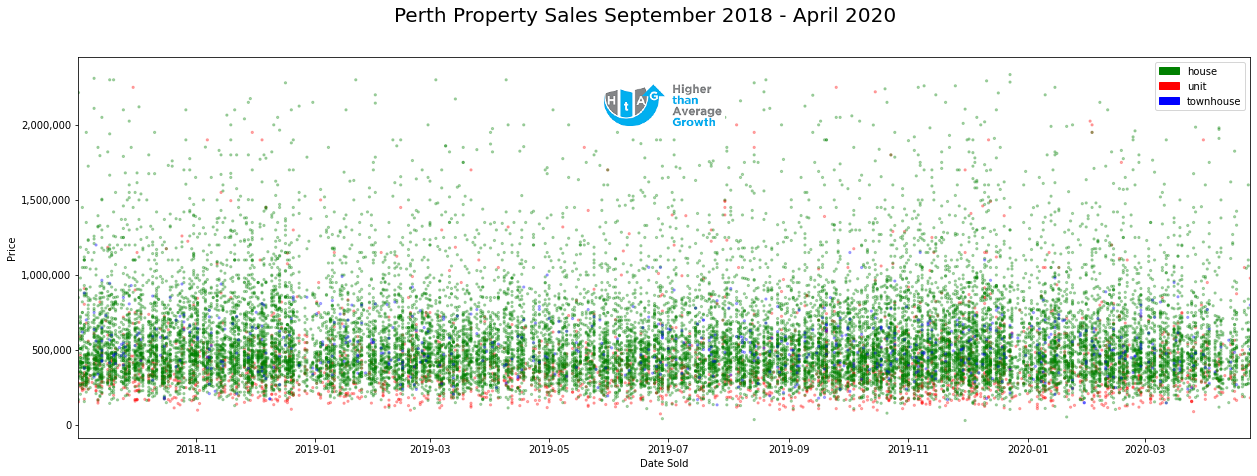
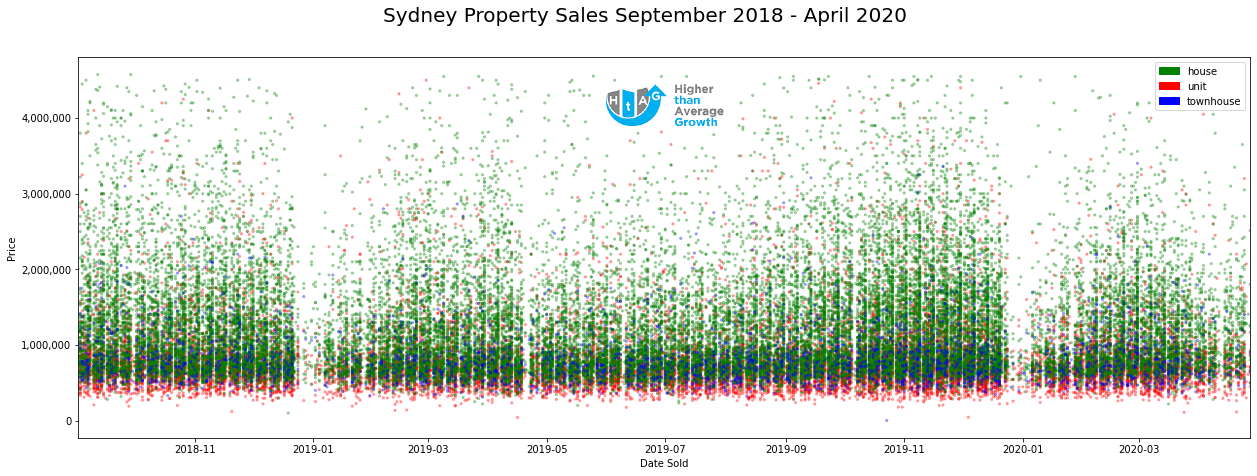
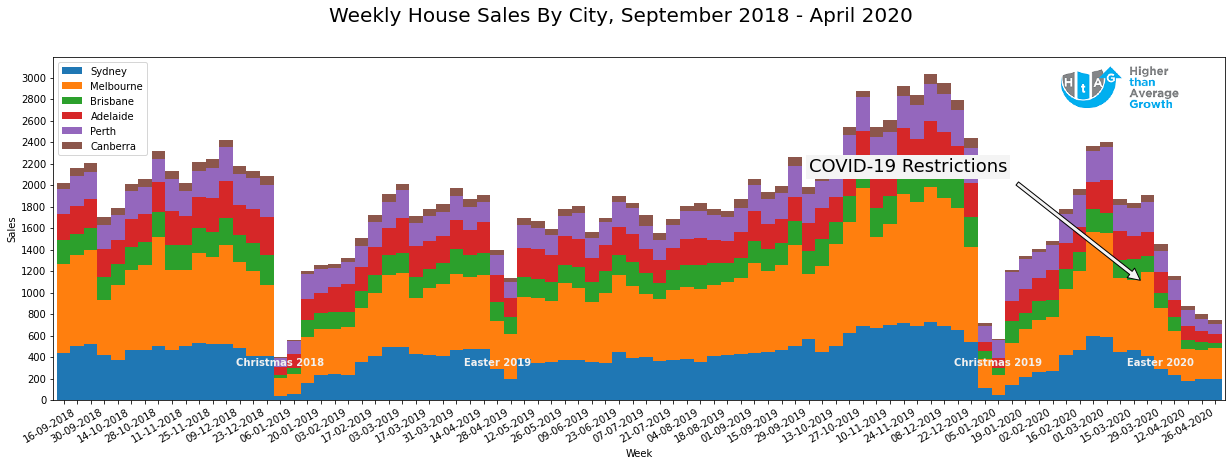
Although there are significant differences in the data for all 6 cities, there are also a few common features. We can observe regular gaps in sales, which can be attributed to the weekends (there are roughly 70 of these gaps on each chart). There is a significant decrease in activity around the Christmas period (2 wide gaps on the charts in December 2018 and 2019).
There is also a somewhat smaller but noticeable slowdown during the Easter weekends (21 April 2019 and 12 April 2020). The latter will present us with some challenges, because it also falls into the slowdown associated with COVID-19 restrictions. We will need to take this fact into account in our assessment.
Impact of COVID-19 on Property Sales
On March 25, 2020 Australian Government issued a ban on auctions and open house inspections. Although most states and territories have since relaxed the restrictions, in effect, there were no auctions or inspections held for at least one month in all capital cities.
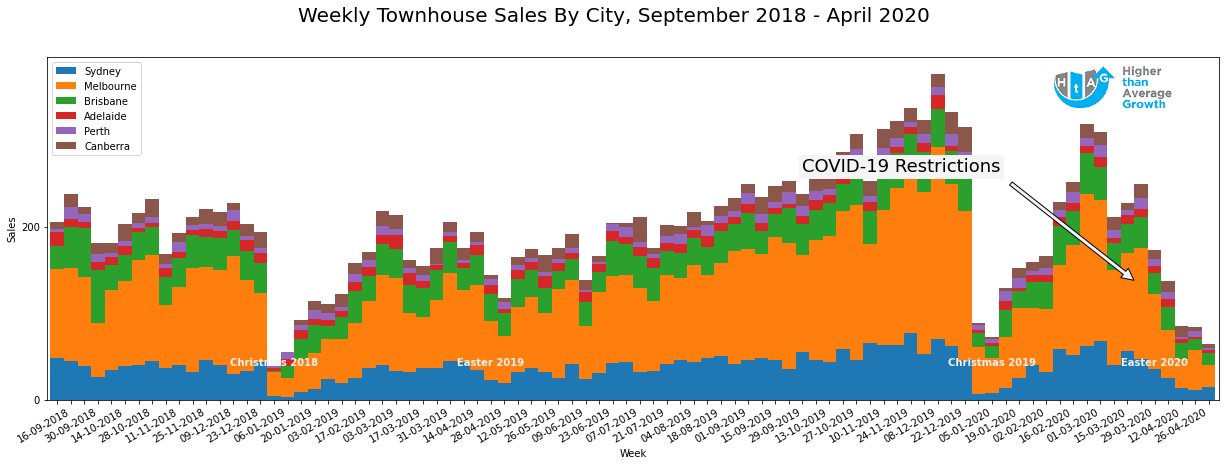
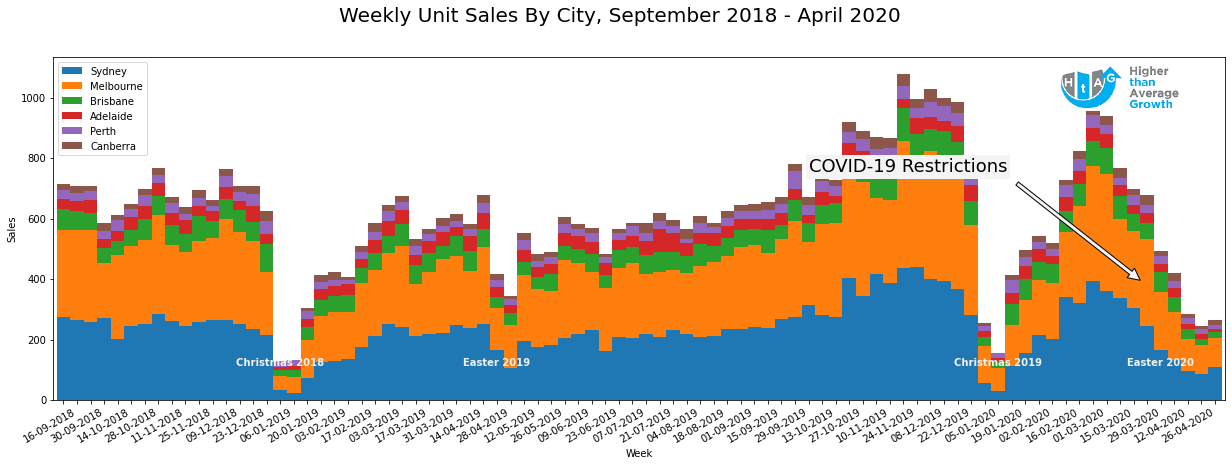
It is important to note that, the ban coincided with the Long Easter weekend (10-13 April) during which, as we have already established, buy and sell activity declined significantly in the previous years. As we see in the bar charts below, that decline was further compounded by the COVID-19 restrictions.
Let’s now explore the trends in the property market that preceded the recent decline in sales activity.
Firstly, we see the magnitude of Christmas period decline. The 2 weeks of Christmas almost bring sales to a halt. It is not surprising, as most businesses shut down and people go on vacations.
Secondly, the 2nd half of 2019 was quite dynamic in terms of the sales volume. At its’ peak week, the urban housing market had 600 more sales recorded compared to the peak in the previous year. We see this accelerated growth in sales activity throughout all the 3 property types: houses, units and townhouses. There is only a minor decline in sales around the 2019 Easter weekend.
Lastly, we see a very aggressive start to the year 2020. The market reached its peak in sales in late February, with the volumes exceeding those recorded for the same period in 2019. The peak was followed by an immediate contraction in early March, with sales then gradually declining throughout the rest of the month and April to their lowest point since the start of the year.
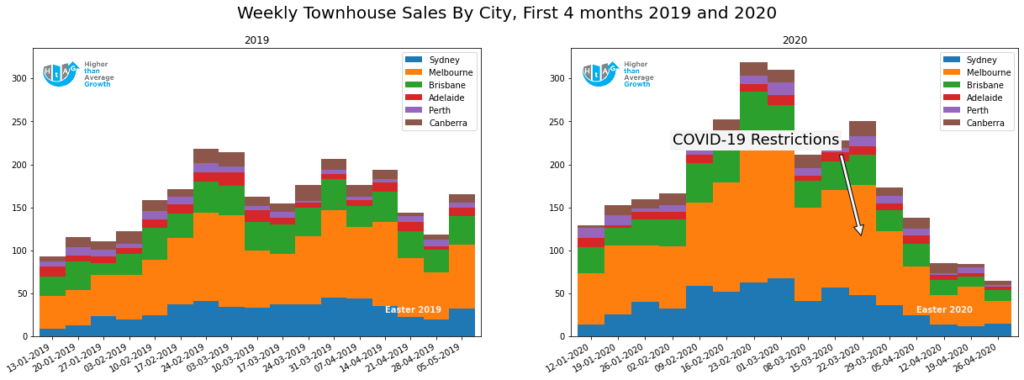
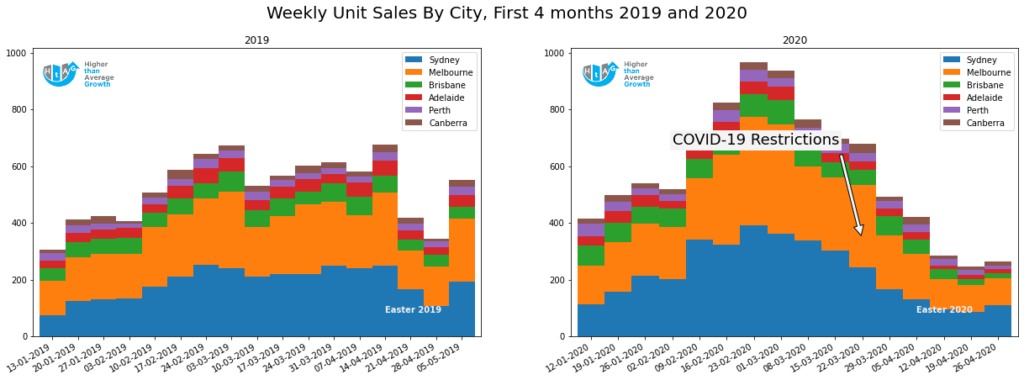
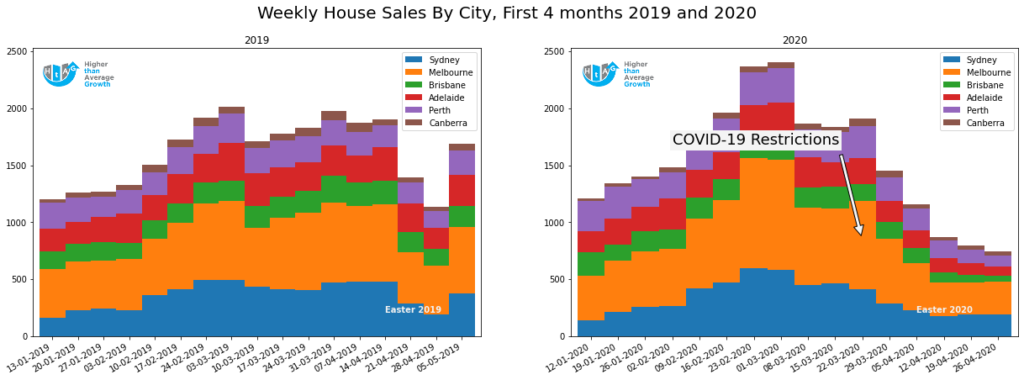
The bar charts above zoom into the first 4 months of years 2019 and 2020, so we can compare the sales in these 2 analogous periods.
2020 Easter came 1 week earlier than in 2019, which is marked on the charts in the right bottom corner. We can see that the sales rebound to pre-Easter levels at the end of the 2 short working weeks in 2019. This is, however, not the case in 2020. The already dwindling sales continued to further decline, with just a minor increase in unit sales recorded after the Easter period. The volume of sales was already 20% under the 2019 minimum before the Easter break in the year 2020.
Overall, we are seeing an almost 60% decline in sales in the post-Easter period in 2020 compared to 2019.
Impact of COVID-19 on Median Price
We have assessed how COVID-19 impacted the sales activity. Let’s now understand whether the reduction in sales translated into the decline in housing prices.
Real estate median prices are commonly reported at quarterly intervals. There is a good reason for that. Housing markets have a rather slow velocity, which is reasonable, considering the high price point and lengthy processes associated with a property transaction. So, for the median price to be representative of the actual true median value, there needs to be a significant amount of sales in the period for which it is reported. A calendar quarter usually accumulates enough sales for the median price to be accurate, however it is not uncommon to see prices reported at monthly and weekly intervals.
We will first explore the median price at quarterly interval. Given that we are in the middle of the 2nd quarter, there should be enough sales accumulated for us to gauge whether the prices have been impacted by the pandemic.
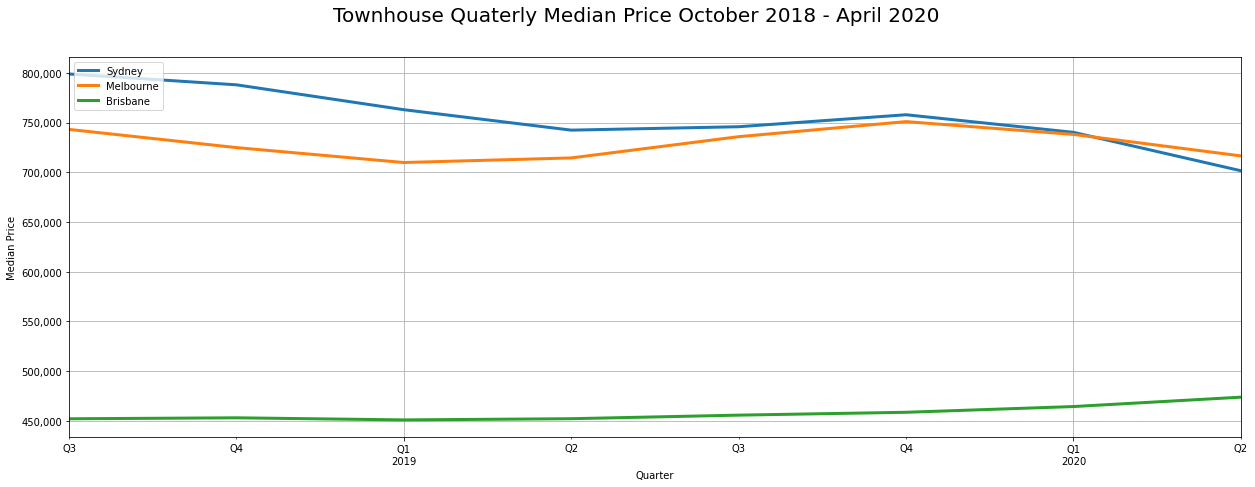
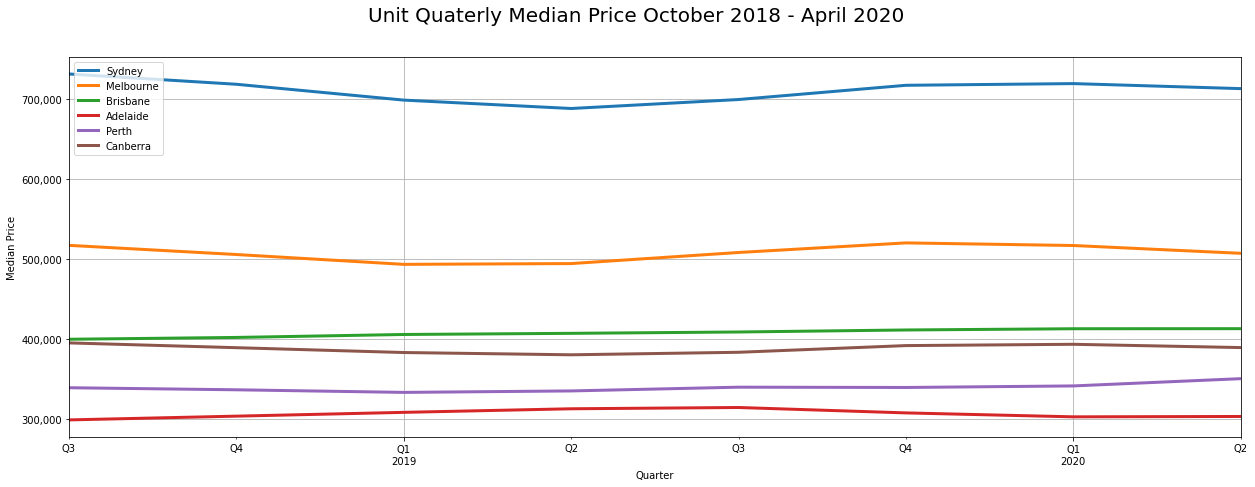
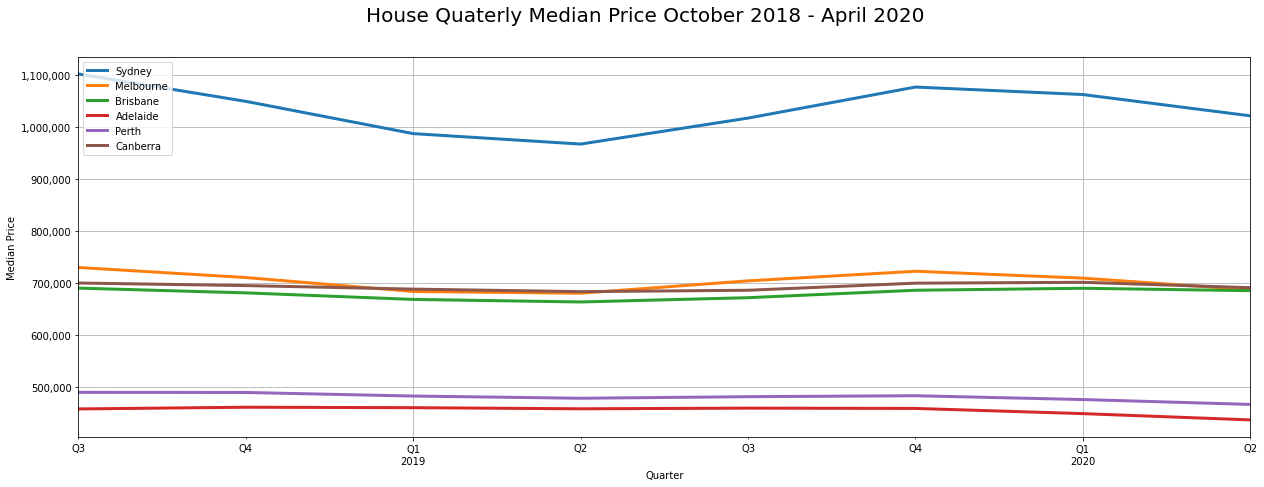
Examining the graphs above, we can see that prices as of Q2 2020 are not at their lowest local (Sep 2018 – April 2020) price point in majority of the urban markets. There are a few notable exceptions:
- Sydney townhouses
- Adelaide units
- Adelaide & Perth houses
Whereas the 3 graphs above tell us a good story, it is difficult to understand how the prices have changed in the time period we are interested in. We will ignore the seemingly high amplitude fluctuations in Sydney median price for now. The chart scale is maladjusted to the lower range of prices in other capital cities, so their medians may appear to be almost linear, whereas in reality they have ups and downs of their own. To better understand these changes, we will need to plot the quarterly percentage difference in median price.
Per cent change charts are frequently used for time-series analysis due to clarity in the presentation of the rate of change over time. One important feature to consider is the thick black horizontal line in the middle that signifies the 0% point at which negative growth transitions into positive and vice versa.
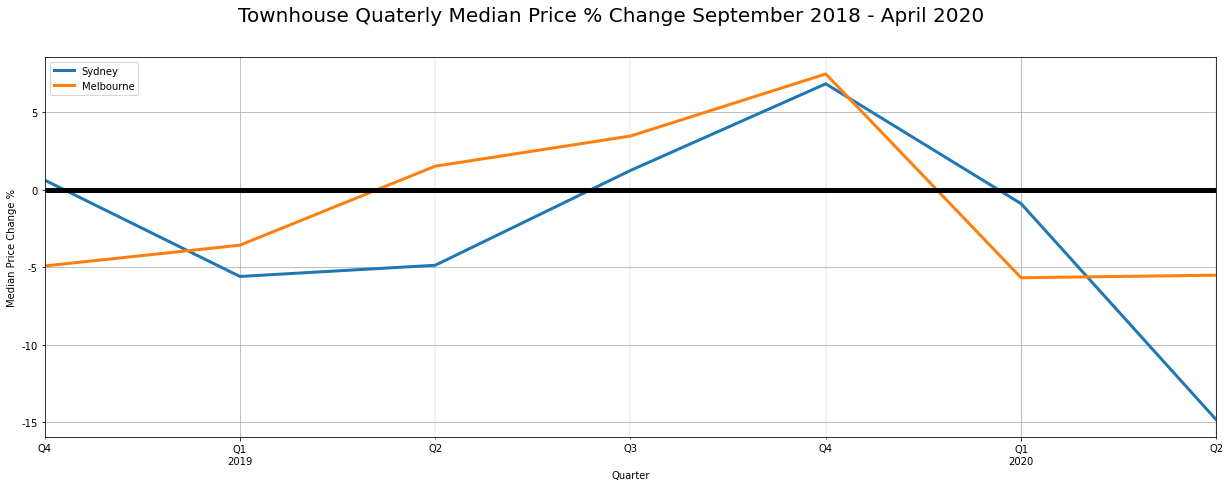
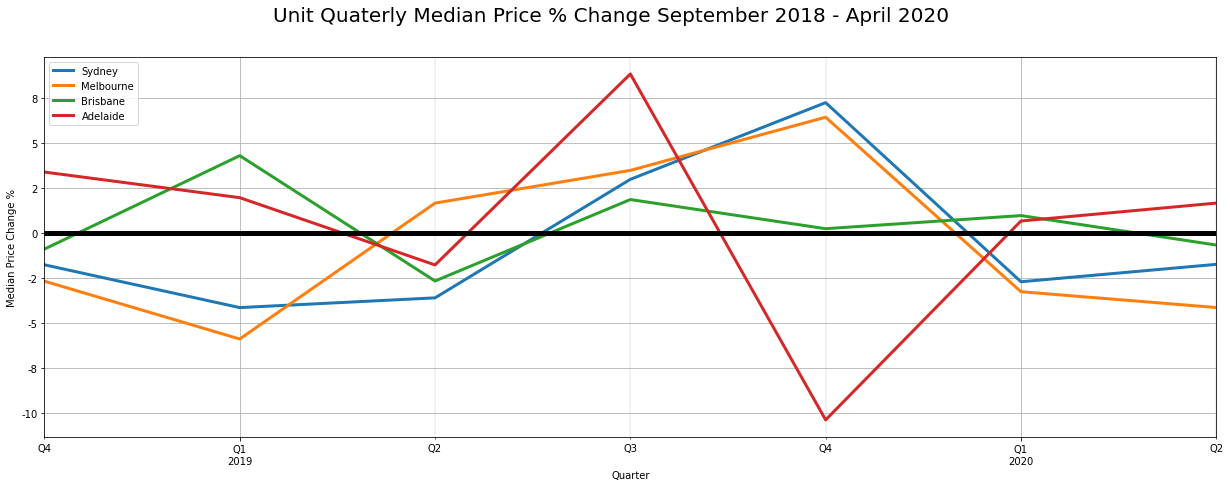
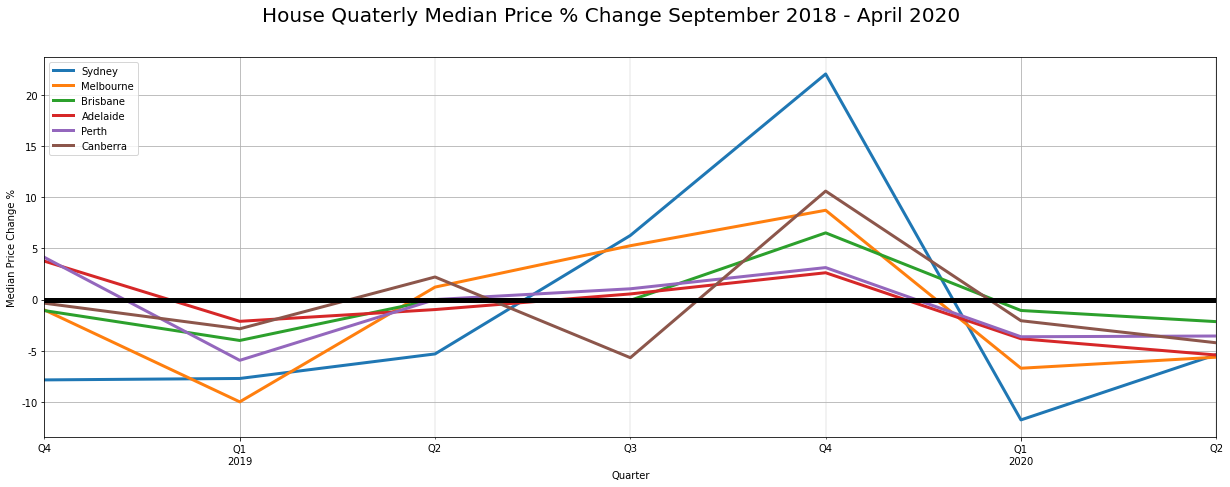
To simplify, a continuously increasing median price will never cross the thick black line to the downside.
Interestingly, Sydney houses have had an unprecedented +20% quarterly growth in Q4 2019. This was followed by a retracement to negative -10% in the following quarter, so it wasn’t just an issue of scale on our median price line charts. We can see that the median price for houses has remained in the negative region for 2 consecutive quarters this year, wiping out most of the gains that occurred in 2019.
It is also important to note that both Q1 2019 and Q1 2020 exhibit a similar rate of decline. This is normal for the housing market, when due to the extended holidays, less sales of the higher-priced properties take place in the first quarter of the year compared to the last quarter of the preceding year. However, the market tends to “heat up” in the second quarter, but as we can see, the house prices for all capital cities remain in the negative territory in Q2 2020.
Units have a different growth pattern to that of houses. Whereas house prices follow a similar cyclical pattern in all capital cities, Adelaide and Brisbane move in counter-position to Melbourne and Sydney markets (at quarterly interval).
Notably, Adelaide units have had a roller-coaster year in 2019, but are showing signs of stabilisation with modest ~1-2% growth in the first 2 quarters of 2020. Brisbane units are just entering the negative territory as I am writing this article closing on -1% decline in Q2 2020. Sydney and Melbourne units are exhibiting 2 consecutive declines in Q1 and Q2 averaging at -2% per quarter.
Interestingly, Sydney townhouses did not fare too well this year. 15% fall in median values is reported for the second quarter in the capital of NSW. Somewhat smaller but more prolonged decline is seen in the market for townhouses in Melbourne.
Conclusion
Based on the latest sales data, a noticeable decline in median price throughout major capital cities is starting to occur. It is reasonable to conclude that the decline is associated with the COVID-19 event, given the preceding market growth in the second half of 2019 and early 2020. There is a definite fall in market activity throughout the nation, although some markets continue to grow despite the downturn.
It is important to note that there are markets within markets and although the prices are declining in most capital cities, there are council areas and suburbs in each city that still exhibit positive growth.
The interactive maps below show YoY growth in Q2 2020 for council areas in Sydney, Melbourne, Perth and Adelaide. Inner Brisbane and Canberra maps chart YoY growth at the suburb level.
I’ll let the maps speak for themselves, but there are some interesting suburbs in Brisbane and Canberra.
Tip: Click on the zoom toggle (  ) to enable mouse scroll control on the map.
We encourage you to always refer to the number of sales in the growth areas to ensure the median price and per cent growth values are calculated against a high enough volume of sales. As a rule of thumb, there needs to be at least 10 sales in a suburb for the median price and growth percentages to be accurate.
Data Source: https://www.kaggle.com/htagholdings/aus-real-estate-sales-march-2019-to-april-2020
Image Source: https://www.kaggle.com/alexfedoseev/covid-19-impact-on-australian-property-market
Map Source: https://www.htag.com.au/covid-19-impact-on-australian-property-market/
By
