9/07/2013
 By Greg Dickason, General Manager of RP Data's Product and Information Systems
A friend asked me recently whether he should invest in shares or property. He asked me because I work for RP Data and have access to deep data on individual properties. I also actively invest in the stock market.
My answer, “depends”, was not to his liking. He wanted a firm answer from me like: “go for property” or “shares are best”.
Why is the question more relevant today? A few key trends are emerging that force more of us to want to make the comparison:
· Increasing numbers of people have super fund balances large enough to make a Self Managed Super Fund an option for them. With Self-Managed Super, they get the freedom (and responsibility) of directly managing where to put their money. This makes the choice between property and shares a real one for them.
· Banks, investment clubs, and others are getting increasingly sophisticated at helping their customers compare assets and show total returns, in simple and easy to understand charts and tables. “myWealth” by Commonwealth Bank is a recent example of this.
· Post the Global Financial Crisis an uncertainty has crept in about how to plan for the future. This is exacerbated by the volatility in the share market, highly visible collapses such as Storm Financial, and perceived uncertainty in the property market. Less Australians are involved in direct share investments now than immediately before the global financial crisis.
So my friend is right to ask the question.
Am I right to hedge my answer with a ‘depends’?
Well, let us take a look by comparing the ASX200 (top 200 companies on the Australian Stock Exchange) to the RP Data Combined Capital Cities Index (Index of the Value of Australian Capital City Property). These 2 measures can be our high level measures of the stock market and the property market.
For this first article we will conveniently ignore the effect of dividends and rent, or the buying and selling costs for each asset. In future articles we will bring these additional revenue streams and costs in to the discussion.
For my first comparison, I have chosen a time horizon from the peak of the interest rate cycle in December 2000, through to the collapse of Lehman brothers in the midst of the Global Financial Crisis in September 2008. This was a period of very low interest rates and the last phase of the ‘Great Moderation’ where inflation and interest rates were also quite stable. Inflation was ‘tamed’ and debt was relatively cheap.
If I had of invested $100 dollars in property or $100 in shares over this period, where would I have ended up? Of course I can’t just invest ‘$100’ in property, but for the rest of this article so we can compare the different assets we will use $100 as our base line. In reality we are talking much large amounts of money.
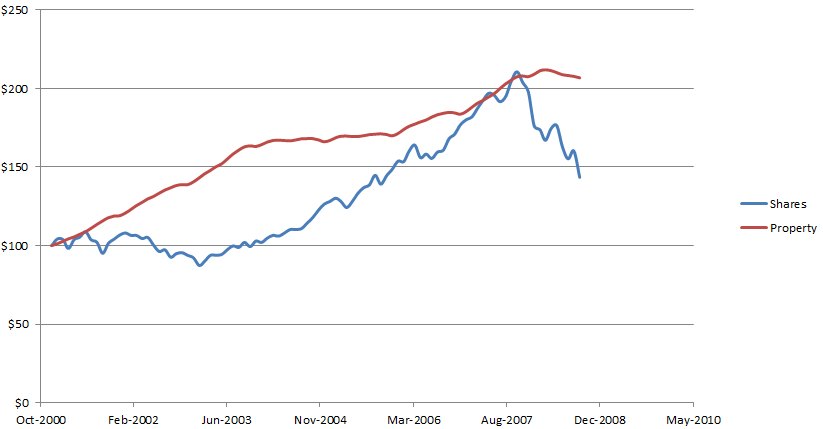
The chart shows very clearly that my property investment would have done wonderfully. By March 2008 my $100 property investment would have been worth almost $212. Shares too did very well, but took a lot longer to start rising. By October 2007 my $100 of shares would have been worth almost $211. Then the wheels fell off, the GFC started and by September 2008 when Lehman collapsed my shares would have been worth only just over $143.
Looking at the chart over this long period makes it quite easy to answer my friend: “invest in property” would be my answer. Why? Because looking at this period he would have got good growth, lower fluctuations in value, and would not have seen prices drop the way they did in 2008 in the share market.
But what if he had been timid in December 2000 and had kept his money under his mattress? Over the next few years he would have heard a lot of press about how the property market had gone ‘gangbusters’ and would have constantly felt like he was missing out. Say by September 2003 he was ready to ‘take the plunge’. By then interest rates were slightly up on their lowest point, but were still very low (under 5%). If he had invested in property then how would he have gone?
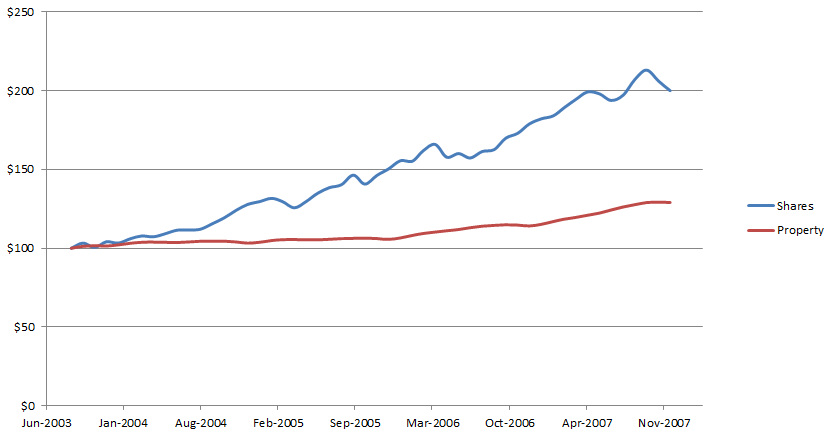
In short – he missed the boat! His $100 invested in September 2003 was only worth about $129 by October 2007, whereas if it had been a share investment it would have been worth just over $213. So just a few years later, a property market investment would have performed a lot worse than a share market investment.
And since the GFC the picture is not at all clear. If instead my friend had waited until September 2008 before investing his $100 he would have made just $107 on the share market and $112 on the property market, as of May 2013:
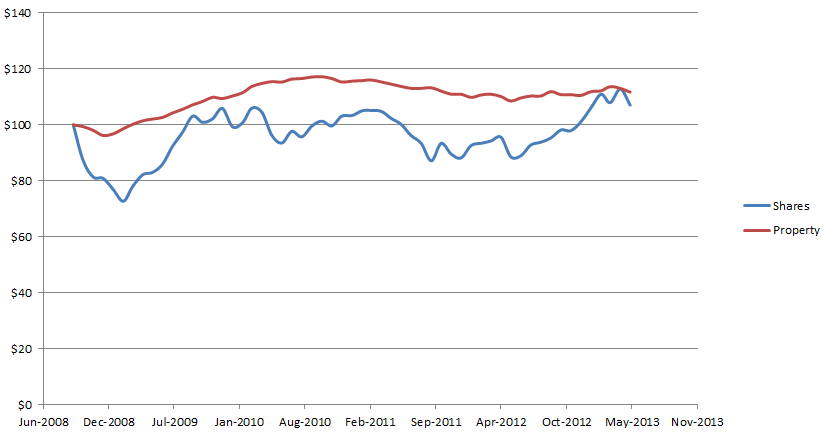
Which explains why other assets like bonds, fixed interest, and dividend yielding shares, are now getting more focus by investors looking for returns. Both property and shares have underperformed in the last 5 years compared to the periods before then.
How do I answer my friend given the above and all the differences? First I would ask a few more questions like:
- How long do you plan to hold your investment?
- Can you avoid selling if you have a crisis come up and you need extra money?
- Do you want to earn income or are you just happy to see growth?
These questions I will look at, with the additional costs and revenue, in future articles.
For now I will leave you with my first recommendation: diversify a little. Buy say $50 in shares and $50 in property so you are exposed to both markets. For the period from 2001 to May 2013 the 3 different options for:
- All $100 in shares
- All $100 in property
- $50 in shares and $50 in property
End up being:
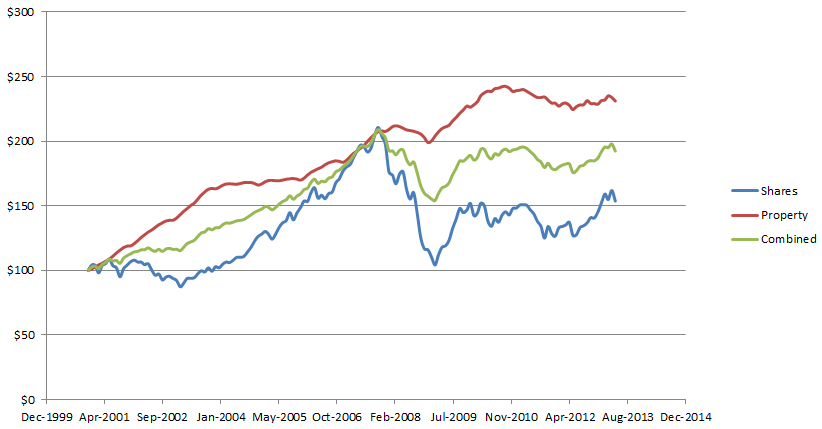
The combined result of a split investment between shares and property is $192, compared with $154 for shares and $231 for property. This shows that diversification reduces some of the upside, but also the downside. Of course if I had invested in property, then switched to shares in 2003, then switched back to property in 2007, I would have done even better. But that ignores the fees of buying and selling both property and shares.
In my next article I will look at the impact of rent and dividends, both of which have significant impacts on total returns. We will also add in the costs of buying and selling to get a closer picture to what an average investor really would have got for their money.
Greg Dickason joined RP Data in 2010 where he took over the management of the group’s data product division. One of the his early highlights was leading the team that delivered the services behind the popular CommBank Property Guide iPhone App. In addition, he patented the popular rpdata Media Maximiser product with a colleague, which correlates advertising spend to selling success for real estate agents

