
Success in property investing rests on many factors, and timing is a big one. Knowing when to sell can make all the difference. In this in-depth feature, we cut through the marketing, analysed various reports, and dug into the numbers to reveal if the 'spring effect' is real and where it shines the brightest.
Investors often hear "sell in spring" - it's billed as the prime time. Historical sales data generally backs that up, although the results are not uniform. Nationally, spring tends to bring more stock, stronger clearance rates, and seasonal price uplifts. However, seasonality varies by city and property type, and it's filtered through supply and local demand.
Across Australia, November (the last month of spring) is the strongest month for sellers, but local conditions can reign supreme.
Seasonal price premium
PropTrack analysis of sales data from 2014 to 2023 shows November is "statistically the best time" to sell, with prices around 0.78% above the yearly average. This means a home selling for $880,000 would net around $7,000 more during a November sale.
Within the season, the second-best month is October, when prices are 0.57% more than average.
However, spring is not the only good time to sell. Warmer months, February (+0.52%) and March (+0.60%), also tend to be strong.
By contrast, the lowest average seasonal prices are seen during colder months, June (-0.96%) and July (-0.87%), when there are typically fewer transactions and most buyers opt to stay in instead of out at auctions or open homes.
Zooming into the sales performance across different markets, spring is not the only time when sellers may yield above-average prices. Seasonal price uplifts, it appears, depend on where your property is located.
"In Sydney, the highest prices are seen in March, while in Darwin it is April," said Paul Ryan, senior economist at PropTrack.
"Adelaide is the most surprising, with the highest prices in July, when nationally prices tend to be a little below-average."
Seasonal variation is quite significant in some markets. Melbourne, Adelaide, and Perth see prices go 1% above average, while Hobart and Darwin see more than 2%.
Listings uplift
Blossoming gardens and warmer Saturdays also tend to bring more activity; data shows new listings typically lift into spring.
SQM Research reported a 5.2% monthly rise in total listings in August, driven by a surge in new stock across Sydney (up 9.8%), Melbourne (up 11.5%), and Canberra (up 6.5%). Compared to a year ago, however, total listings fell 4.2%, suggesting lingering caution among sellers and buyers.
Meanwhile, new listings under 30 days surged nationally by 14.4%, with Sydney and Melbourne again leading the charge, as the market readied for spring - a pattern consistent with prior years.
"This influx of fresh stock may reflect pent-up supply following winter lulls, as well as strategic vendor timing ahead of spring campaigns," noted Louis Christopher, managing director of SQM Research.
In 2024, for reference, new listings rose to their strongest September since 2015 - up 10.1% nationally and 13.7% across the capitals - per PropTrack's September 2024 Listings Report.
Sydney and Melbourne posted their strongest September new-listings counts since 2015, while Canberra had the highest for any September since 2004.
Clearance rates
Auction clearance rates hold strong but can vary. Through the 2024 spring, combined capital preliminary clearance rates averaged at around 66-67%, with weekly volumes in mid-spring often topping 2,500-2,800 auctions.
According to Cotality data furnished for Your Investment Property Magazine, the weighted average clearance rate through last year's spring was 59.9%. To be considered a seller-friendly market, this has to hover above 70%. This typically indicates competition among buyers. However, the spring selling season in 2024 was marked by low demand amid high interest rates.
In October last year, Australia's home prices edged to fresh highs with buyers "out in force" at the height of the spring selling season, PropTrack senior economist Eleanor Creagh noted.
It's looking to be a different story this time, however. Fresh Cotality data shows vendors are in a strong position, with auction clearance rates hitting 70% in late August, amid relatively mild competition among vendors.
A very general rule of thumb is that as auction volumes increase, the clearance rate decreases.
It's important to note that clearance rates are influenced by many factors. Consumer sentiment, interest-rate outlook, supply, macroeconomic settings, local holidays and even campaign quality can push clearance rates up or down.
Average Spring Auction Clearance Rates
|
Spring 2024 |
Spring 2023 |
Spring 2022 |
|
|
Sydney |
60.6% |
66.1% |
59.8% |
|
Melbourne |
59.2% |
62.9% |
61.3% |
|
Brisbane |
54.0% |
61.2% |
44.4% |
|
Canberra |
53.8% |
52.6% |
57.3% |
|
Adelaide |
68.4% |
76.0% |
68.2% |
Source: Cotality
Spring effects on capital cities
We combine seasonal price patterns, listing depth, and auction performance in each capital city based on the latest published reports and historical data to determine the "spring effects" and how they vary by location.
Our 'investor take' distils city-by-city data into practical insights for property investors. Please note that it is intended as a general market commentary only and does not constitute financial or investment advice. Outcomes depend on individual circumstances, local conditions, and broader economic factors.
Sources include Cotality, PropTrack, and SQM Research.
Sydney (NSW)

Seasonal premium: Home prices typically peak in March (+0.85% above average), although November (+0.40%) offers a relatively mild price uplift
Listings and auctions: Around 900-1,000 auctions in peak weeks, with mid-60s clearance rates common in the spring selling season.
Investor take: Historical data reveals Sydney is a two-window market - prices tend to peak in March (autumn) and activity swells in October-November (spring). Expect firmer conditions in both windows. If you're selling (or buying) high-priced properties, the auction process during the busy spring season helps reveal a fair market price and lets sellers move quickly.
Melbourne (VIC)

Seasonal premium: October (+1.11% above average)
Listings and auctions: Melbourne is Australia's busiest auction market each spring, hosting around 1,100 auctions per week. The recorded monthly change in August shows a swell in supply, with total listings up 11.5% and new listings climbing 27.5%.
Investor take: If you're selling in Melbourne, spring (especially October) aligns price seasonality with maximum buyer depth. Better pricing conditions combined with lots of bidders usually translate to cleaner, faster sales at market-representative prices.
Brisbane (QLD)

Seasonal premium: October (+0.56% above average)
Listings and auctions: Around 120-150 auctions per week during spring; local analysis revealed Brisbane had the strongest clearance rate in winter 2025 - 74.5% preliminary clearance rate in the week ending 27 July.
Investor take: Considering the mild price premium during the spring selling season and the noted strength during winter, timing seems less critical in Brisbane. Focusing on the asset over the calendar is a good strategy. Seek local guidance on whether you should sell via private treaty or auction.
Perth (WA)
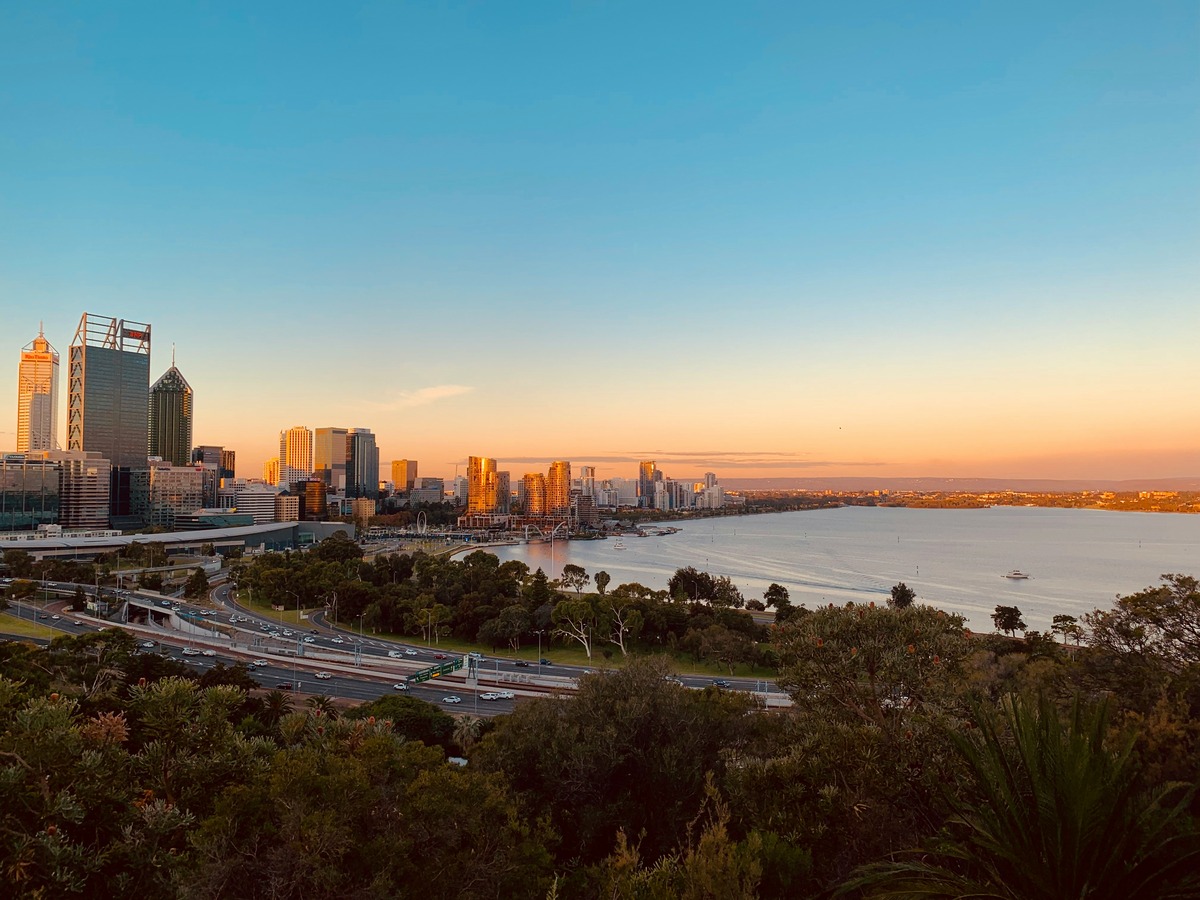
Seasonal premium: November (+1.30% above average)
Listings and auctions: November 2024's listing volume in Perth was the highest monthly increase (up 20%). However, the capital remains predominantly private treaty, with typically less than 20 auction counts per week.
Investor take: Spring is an attractive time for execution in Perth, as it is one of the capitals where the "best month to sell" yields prices above the average by more than 1%. If you lean into the spring selling season, you can get the best shot at a quick, clean result. With it being a predominantly private treaty, consider well-signposted campaigns with strong pre-market buyer work.
Adelaide (SA)

Seasonal premium: July (+1.37% above average)
Listings and auctions: Robust clearance rates across 2024 (around 70% in late October); recent data (first week of September 2025) shows this year's spring is shaping up to be a busy season with preliminary rates at 74.5%. Current low stock translates to multiple bidders, especially on quality houses.
Investor take: With active auctions and engaged bidders, selling in spring helps with speed and in delivering clean results, even though July tends to be the price peak on averages.
Canberra (ACT)

Seasonal premium: November (+1.49% above average)
Listings and auctions: Based on recent data (Aug 2025), the ACT capital is entering the spring season with a surge (24.6% month-on-month) in new listings, suggesting "growing market confidence". Previous data revealed Canberra posted the highest annual increase in total property listings among capitals in November 2024 (23.3%).
Investor take: Canberra is one of the capitals where spring tends to deliver a sale-price premium. Recent reports revealed selling times have been improving - i.e. shorter - this year compared to a year ago. Selling in spring pairs seasonal price uplift with a deep buyer pool. However, as listings also swell, you'll want to ensure your property stands out (presentation, minor works, strong campaign).
Hobart (TAS)

Seasonal premium: November (+2.34% above average)
Listings: Previous data revealed new listings fell in the first month of spring (-1.6% in Sept 2024), bucking the national spring narrative. August 2025 figures show both new (-13.6%) and total (-3.0%) listings plunged as we enter the spring season.
Investor take: Hobart offers one of the strongest price seasonality effects in the country, but the lead-in to this spring looks supply-constrained. If those August declines hold, expect limited buyer choice and firmer pricing for well-located houses. If selling, aim for November, if possible.
Darwin (NT)

Seasonal premium: April (+3.43% above average); November yields -1.69%
Listings and auctions: Total listings in the lead-in to 2025 spring in Darwin saw the biggest annual decline (-36.9%), while new listings also fell by 3.2%. In September 2024, the capital posted negative listings figures as well.
Investor take: Darwin is the outlier on spring seasonality. It is also crucial to consider that the Northern Territory capital has volatile rental dynamics, with the vacancy rate susceptible to fluctuations due to the transient nature of its population. This lack of reliable spring uplift suggests that the calendar is a poor timing tool compared with reading local demand pulses.
Spring selling season: Bloom or bust?
While spring does often live up to its reputation, the numbers show it isn't the golden season everywhere. Local demand, supply, and other factors can outweigh the calendar.
Investors looking to maximise returns should think strategically. In Melbourne, align sales with October's uplift and auction depth; in Sydney, don't overlook March; in Adelaide and Darwin, consider off-season highs.
Ultimately, property markets reward those who understand the rhythm of local supply and demand rather than relying on a one-size-fits-all seasonal strategy.
Images from Pexels and Unsplash