First published 12/01/2012
Can rental yield be used as a tool for predicting future increases in values? According to Jeremy Sheppard, it can be a powerful way to find markets ready to grow, but cautions investors to keep a few things in mind.
Rental yield is a measure of how much cash an income generating asset produces each year as a percentage of that asset’s value. For real estate it is the rental income as a percentage of the property’s value.
There are two kinds of yields you’ll hear about: gross yield and net yield. The gross yield is most often quoted and is easily calculated. For example, if the rent charged to live in a property is $300 per week and the value of the property is $400,000 then the gross yield will be $300 x 52 wks ÷ 400000 x 100 = 3.9%.
The net yield is much more important but not nearly as easy to calculate and therefore less often quoted. A very simple net yield calculation for an imaginary property is shown in table 1.
Simple net yield calculation
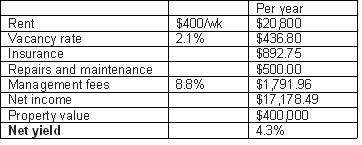
Note that mortgage interest and tax aren’t usually considered in the calculation of net yield. This is because these variables are largely up to the circumstances of the owner and aren’t directly related to the property itself. When selling a property, the current owner may know nothing about the potential buyer’s circumstances. So they advertise details about the property in isolation. You should however include mortgage interest and tax in your calculations of return on investment. You should also consider depreciation, land tax, stamp duty, mortgage insurance, etc.
In fact a comprehensive spread-sheet should be drawn up for every property you consider. If you’re not good with spread-sheets, perhaps you should re-consider whether investing is for you right now. I’d suggest investing in your education and coming back to investing when you can create a return on investment spread-sheet. It’s not that hard and there are plenty of free tutorials online.
All investing, regardless of whether it’s shares, property, foreign exchange, small business, whatever the vehicle, is dependent on 2 things: risk and return. If you can’t estimate both, even roughly, with an objective set of numbers, then investing is definitely not for you.
A high yield means good cash flow for investors improving their return on investment. Good cash flow makes it easier to get loans approved to purchase more property. That’s all good and well, but the reason why the yield is included as one of the variables that make up the DSR is because it is a pre-cursor of capital growth.
Which is easier, getting a lease or getting a mortgage? Clearly, it’s easier to get a lease. So it is easier to move if you’re a renter than if you’re an owner-occupier. This means tenants are more agile than owners. So when a location becomes attractive, renters are the first to make a move on it.
A location may become attractive because new businesses open in the area providing employment opportunities. Or perhaps a new train station is built, or perhaps other areas have simply become too expensive. Whatever the reason, it is the renters that are likely to get there first. They increase demand for rental accommodation and this places pressure on rents to go up. But since they don’t buy, the property prices aren’t under the same pressure – only the rents go up. This increases the yield.
Investors may notice that the yield in these attractive locations is higher than in other areas. This will attract them into the market once renters have had their influence.
If renters find a location attractive, it is rarely the case that owner-occupiers will not. Both demographics are human and look for similar qualities. So with renters demanding accommodation, investors buying and eventually owner-occupiers buying, prices are more likely to go up. But the lead indicator was the yield.
Note that yield may not always be a lead indicator of capital growth. Some investors focus purely on the yield without any consideration of how the yield got so high. It is possible that the yield rose not because of increasing rents, but because of falling property prices. A quick check of what rents and property prices were a year ago will protect you from this trap for novice investors.
It is possible to have high yields in locations dominated by renters but where owner-occupiers are reluctant to buy. An example of this is a location with a heavy concentration of housing commission homes. Mining towns are another example. People have to live there to work there, but they don’t want to be there forever, so they rent rather than buy. Once the yields get truly high, the majority of price pressure comes from investors in these locations rather than owner-occupiers.
In summary, a high yield represents a keen interest from renters compared to the interest from owner-occupiers. The question is: will that keen interest migrate to the minds of buyers as well? Quite often it does.
Where do you get Yield data?
The easiest place to get yield data is the back of the very magazine you’re reading. Gross yields are listed for all suburbs around Australia where data is sufficient. Keep in mind that the gross yield is calculated using median rents and median prices. So if either is suffering from statistical anomaly, the yield could need some validating.
You can validate the gross yield yourself by checking typical rents on a website like www.realestate.com.au. Be sure to un-tick, “Include surrounding areas” and also select a specific dwelling type: houses or units.
Multiply the typical weekly rent by 52 and divide that total by the typical value of property to get the gross yield. You’ll have to multiply by 100 to get the figure as a percentage.
Is the Yield reliable?
The gross yield is one of the most unreliable statistics commonly quoted about property markets. The reason why is because both variables needed to calculate it are highly susceptible to statistical anomaly. One statistical anomaly multiplied by another can result in an exponentially unrealistic figure. This is especially the case where there are multiple markets within a market, like where there are 2 house markets in the one suburb.
For example, there may be a suburb with old 2 bedroom single storey fibro houses worth $200,000 that rent for $200 per week. And the same suburb may have brand new 4 bedroom double storey full brick houses renting for $400/wk. One month 3 houses sell: 2 of them are the old fibro houses and one is a new brick house. So the median is $200,000.
The same month 3 leases are signed: 2 of them to rent the 4 bedroom brand new houses and one lease for a fibro. So the median rent for that month was $400/wk. The yield for that month was therefore over 10%. That’s $400/wk median rent versus $200,000 median value.
But let’s say that next month more new houses sold than old houses. So the median rose to $400,000. This is not 100% capital growth in one month – it’s a statistical anomaly. The same month, more fibros rented than new brick houses. So the median rent was only $200/wk. This is not a 50% drop in rents – it’s a statistical anomaly. The yield for that month was therefore a little more than 2.5%. That’s $200/wk median rent versus $400,000 median value.
As mentioned in the previous section, you can always verify the gross yield yourself. Check out the type of properties being rented against those being sold.
Given how often the gross yield can get unrealistic, it really is important to validate this yourself before basing any investment decisions on it. You should also combine statistics to improve the overall accuracy of the demand to supply ratio within a suburb. If all the stats agree, there is more assurance that those figures are accurate. If one or two don’t fit in, perhaps they’re suffering from statistical anomalies.
How can investors use the Gross Yield?
Checking the gross yield can be another one of those quick statistics you research as part of your initial due diligence. You should use the yield to estimate cash flow and to calculate projected return on investment. The yield can also be used to predict potential for capital growth. But you need to make sure that the yield is not high due to falling property values, rather from rising rents.
It’s also important not to get carried away with chasing high yields. Many investors place too much emphasis on the yield without focusing on the big picture – total return versus risk. Just check out the side box. It compares a very high yielding investment with a low yielding investment. But the lower yield investment actually has a better overall return.
Cash flow is obviously an important part of investing. If you can’t service more debt, then you can’t acquire more property. But if you have good cash-flow and poor equity, you also can’t acquire more property. So a balance is needed and this balance may change depending on each investor’s circumstances.
Those investors on low incomes will need to address cash flow right from their 1st property. However, those investors paying a lot of tax can afford to focus more on capital growth.
Keep in mind that along with capital growth comes rental growth. The same drivers of demand and the same shortage of supply that cause property values to rise, are also working to increase rents. This is why many cash-flow crazy investors will often claim they get both high growth and high yield. The key is not finding high yield, but finding the imbalance between demand and supply that leads to increasing rents and increasing value.
Those investors who have large cash-flow positive portfolios usually have low loan to value ratios. This kind of equity comes from good growth not from good cash-flow. If you focus on growth, you’ll eventually get the cash-flow positive portfolio - and a bigger one.
What is a good figure for Gross Yield?
The DSR spreadsheet showed the Australia-wide average yield for the month ending June 2011 as 4.67% for all dwelling types. Units typically have a higher yield than houses. Units with a yield of around 5% are considered normal. Houses will be closer to 4.5%.
Once again, you should apply a quick sanity check to any statistic with some more online research and some common sense fundamental research. As I’ve explained earlier, it can be quite difficult getting an accurate figure for yield.
Conclusion
I am often asked to provide an appraisal for a location on behalf of our clients. The yield is just one of the statistics considered by the DSR which I use to quickly gauge if the market is ready to buy into for capital growth. With 15,000+ localities around Australia it makes short-listing the next hot spot so much easier.
Jeremy Sheppard is director of research for Redwerks and a keen property investor. He created the Demandto-Supply Ratio (DSR) and is the author of How to Find Property Hot Spots. Visit DSRscore.com.au
