Experts tell us that suburbs with a history of strong growth tend to provide the best investment opportunities, but looking back at the past is like driving a car and using only the rear-view mirror.
We know where we’ve come from, but not where we are going to – and because the dynamics of housing markets change over time, we need to have a reliable guide to the future, not the past.
In this respect the new Census data comes to our rescue, with a quick and highly accurate tool to help us find ‘buy and hold’ suburbs – that is, areas where properties tend to provide the best long-term growth potential.
It’s called the ‘unoccupancy rate’ and it gives us the percentage of empty homes in any suburb or town.
The reason it is useful is that there is a close correlation between high long-term house price growth and low unoccupancy rates.
Unoccupancy rates explained
According to the new Census data, about 11% of all our dwellings are unoccupied at any time. That represents over one million empty homes, and while that number does seem large, there are many reasons why dwellings can be empty.
Unoccupied homes make up nearly 30% of the dwellings in the Tasmanian suburb of Zeehan. Many of these properties have been abandoned because younger people have left the area and the demand for housing is falling. Forty per cent of the properties in the regional Queensland town of Dysart are also unoccupied. Many of these were speculative purchases made by investors during Queensland’s coal mining boom years.
A staggering 77% of houses in Victoria’s Sorrento are unoccupied, but unlike Zeehan or Dysart, that’s not a bad thing at all, because they are bought and sold as holiday homes, for which there is high demand. This means that even though they are empty for most of the year, the vacancy rate in this area is intentional.
"Sydney’s overall unoccupancy rate is below 8%, while in Darwin and Perth it’s much higher, at 11%"
Another example of this deliberate unoccupancy occurs in high-density inner-urban suburbs such as Melbourne’s Docklands precinct, where nearly 20% of apartments are vacant. These are not rental vacancies, representing a huge surplus of rental stock – rather, many of these properties have been deliberately left locked and unoccupied from day one by their overseas owners, who purchased them for long-term security rather than rental income.
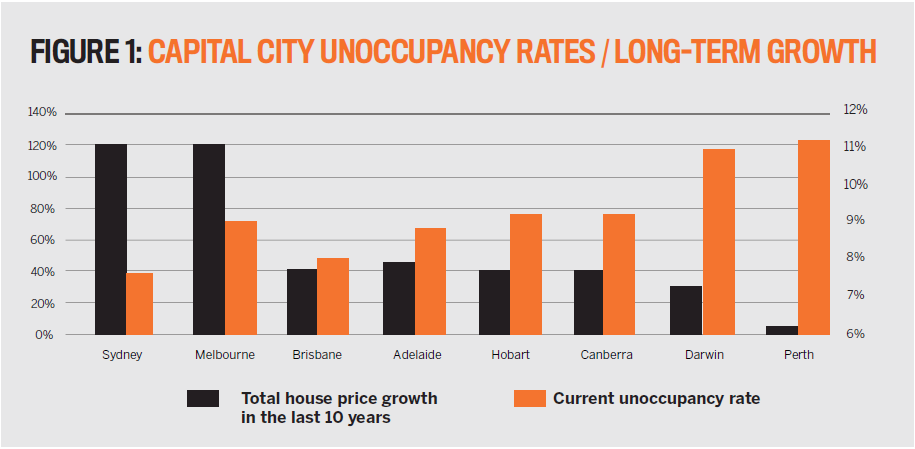
If we exclude these dwellings from the count, we are still left with impressively large numbers of empty homes, even in our big capital cities, as Figure 1 shows.
Sydney’s overall unoccupancy rate is below 8%, while in Darwin and Perth it’s much higher, at 11%. Dwellings may be vacant because they are for sale or awaiting settlement, while some are rental vacancies and others are being renovated or are up for redevelopment.
There is a higher percentage of unoccupied homes in Perth and Darwin because demand is low and there are more properties on the market in these regions. This then puts downward pressure on prices, and you can see this effect in Figure 1, which also compares the long-term house price growth in our capital cities to the percentage of houses currently unoccupied. There is a strong correlation, with fewer empty homes corresponding to higher long-term price growth.
The same correlation occurs at suburb level: suburbs with lower unoccupancy rates also have higher long-term price growth rates and therefore make better buy-and-hold investments.
Longer than average unoccupancy rates
The fact is, fewer empty homes in a particular suburb translates to higher long-term growth potential.
There are around 9,300,000 residential properties in Australia, of which about 540,000 are bought and sold each year.
This means the average period of home ownership is around
17 years, but there are two types of suburbs where the period
of ownership is much longer and the level of unoccupancy is consequently much lower than the average, And there are two main types of households in these suburbs.
"A staggering 77% of houses in Victoria’s Sorrento are unoccupied … because they are bought and sold as holiday homes, for which there is high demand"
Firstly, there are families who have upgraded once or twice before to bigger homes in better areas, where they may live for 25 years or more. The suburbs they move to are usually well established, with good services and facilities, and the houses they buy become family homes. When the owners eventually do sell, it’s because of work commitments or their children have grown up and the family home has become an empty nest.
Secondly, there are group households in suburbs where there are tertiary institutions and property owners let out rooms to students. Even though the students frequently move in and out, there are always some tenants in such group households. They generate constant rental demand and high rental yields for their owners, who consequently rarely sell their properties.
This long-term ownership means these suburbs have a relative scarcity of housing stock compared to other suburbs. Homes in these suburbs are not bought and sold often and don’t stay on the market very long. This is what real estate agents refer to as market ‘tightness’, which in turn endows such localities with the highest long-term growth potential of all our housing markets.
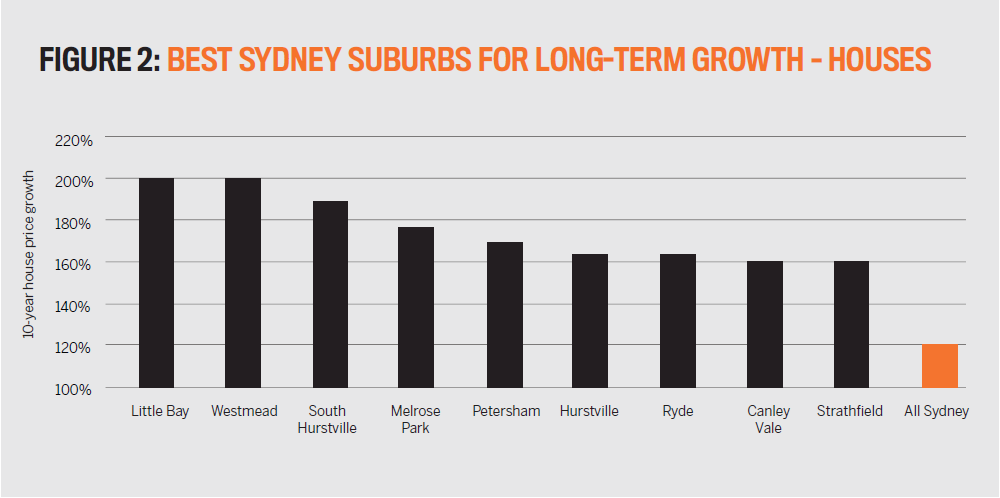
Figure 2 shows the Sydney suburbs that have enjoyed the highest long-term growth in house prices over the last 10 years, compared to Sydney’s median house price growth over the same period.
While Sydney’s house prices have risen by around 120% in the last decade, house prices in the suburbs shown in Figure 2 have grown at much higher rates over the same period of time.
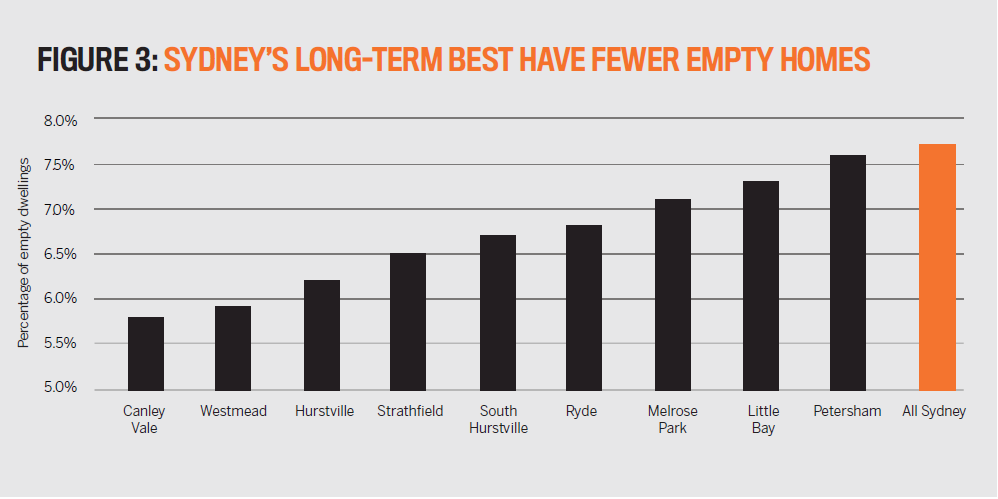
Now look at Figure 3 and you will see that these same suburbs have much lower unoccupancy rates than Sydney as whole.
This phenomenon is not unique to Sydney. Figure 4 shows the best long-term house price performers in Melbourne over the last 10 years compared to Melbourne as whole.
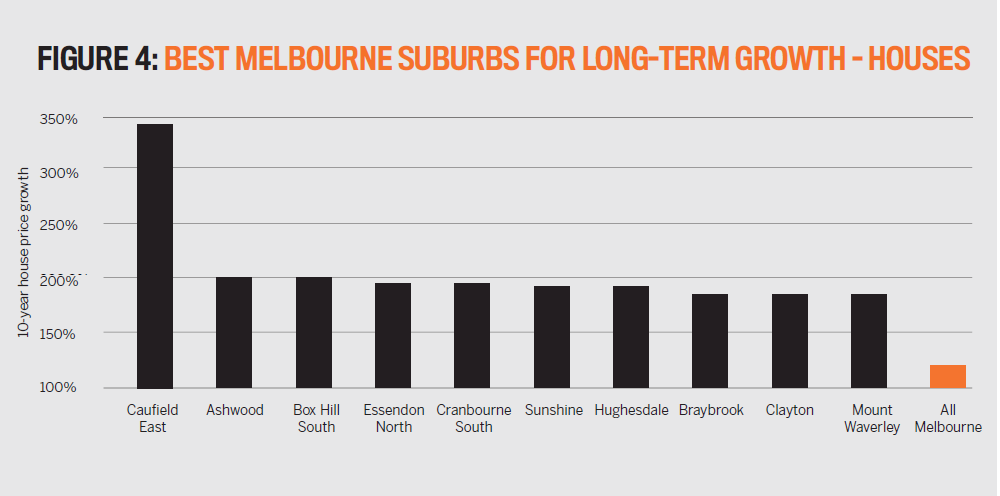
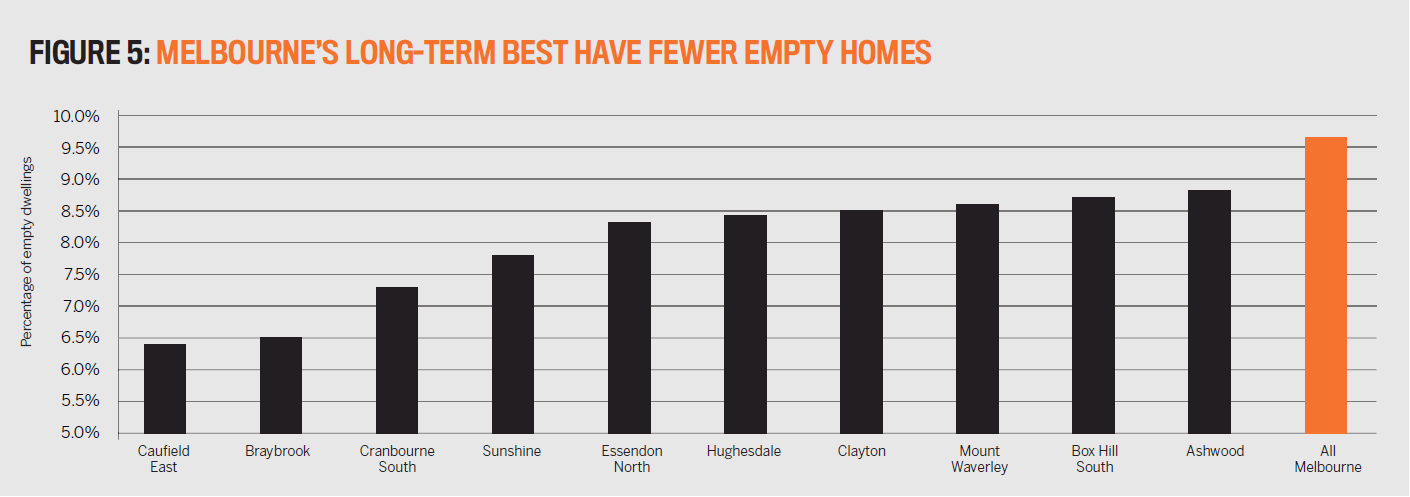
Melbourne’s best-performing suburb over the last decade has been Caulfield East, with average house price growth of 16% annually. This has resulted in an overall rise in the median house price of nearly 350%. The suburb with the next-highest house price performance Ashwood, with growth of 200% – almost half the growth rate of Caulfield East.
Now look at Figure 5(overleaf), which shows you the unoccupancy rates of Melbourne’s best long-term house price performers compared to Melbourne as a whole. Not only are they all lower than Melbourne, but the best performer, Caulfield East, also has the lowest unoccupancy rate.
"There are two types of suburbs where the period of ownership is much longer and the level of unoccupancy is consequently much lower than the average"
It is not coincidental that over half of Caulfield East’s residents are upgrader families and nearly another quarter are made up of student group households.
This relationship between high long-term growth and low unoccupancy rates is repeated in every capital city and makes it easy for you to find which suburbs have the greatest long-term growth potential.
Using unoccupancy rates from the latest Census data to find the best buy-and-hold suburbs has some huge benefits for investors. The data is free, easy to understand, and best of all it’s highly accurate, because while a suburb’s high past price performance is telling you what has happened, its low unoccupancy rates tell you whether it is likely to continue.
• The unoccupancy figures for every suburb are revealed in the new Census data.
• Google ‘Census 2016’ to find the ABS site, then click on the Census menu bar and you’ll see ‘Data by Geography’, where you can search the data for any suburb using QuickStats.
• In the QuickStats search box at the top left of the page, simply type in the suburb’s name, and click GO.
• Scroll down to ‘Dwellings’.
The Dwelling Count reveals the percentage of all dwellings that were unoccupied when the Census was conducted.
•You can find the best suburbs for long-term price performance by looking them up in the Price Guide at the back of this magazine. The Average Annual Growth shown gives you the average yearly price change over the last 10 years, which is what I used in the examples given above.
 John Lindeman
is director of Lindeman Reports,
and author of Unlocking the
Property Market