Property is back in the news and making headlines again.
But in a very different way to this time last year.

Rather than being worried about property Armagedon, now the commentaotrs are asking how strong will the markets be with a recent forecast by SQM Research suggesting dwelling prices could rise by more than 15% in Melbourne and Sydney next year.
After struggling for two years, the Australian housing markets are on the up, now delivering positive growth for 4 months in a row.
Three interest rate cuts, tax cuts, reduced uncertainty around housing, more positive media and easing in the overly tight bank lending guidelines have combined to generate a significant improvement.
Buyers are back borrowing money and looking for a new home or investment and sellers are tentatively returning to the market.
This month Corelogic reported the largest month-on-month gain in their national home value index since May 2015.
Nationally, property values recorded the fourth consecutive month of growth in October taking growing value 2.9% higher of the quarter.
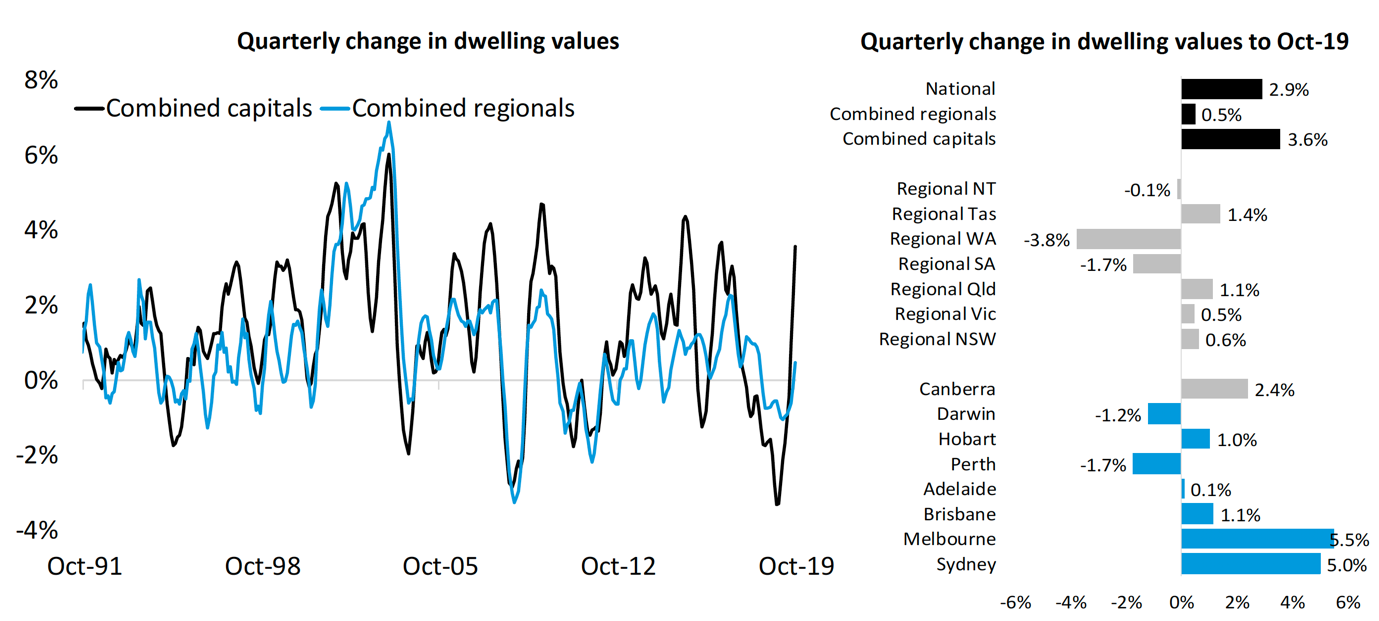
However our markets are fragmented – whereas the Sydney and Melbourne property markets are showing a clear turn around (both with over 5% gain in values the last quarter), as you can see from the chart below from Corelogic the other states are still lagging.
Sydney Property Market
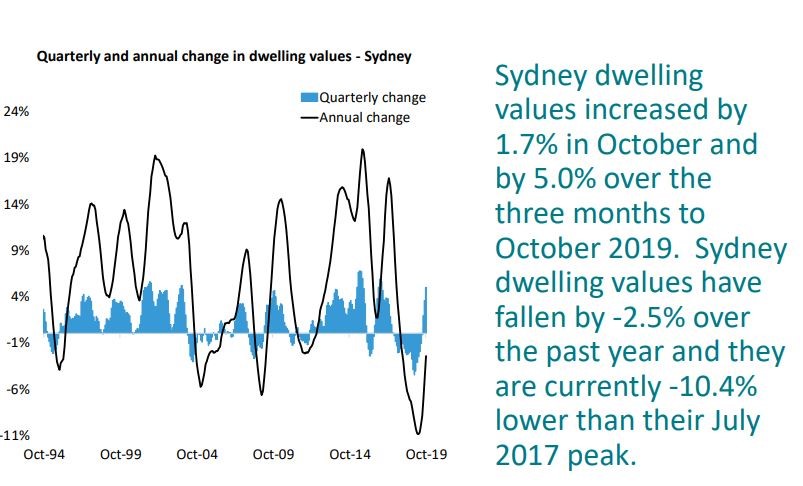
The Sydney property market is on the move having recorded its quickest turnaround in decades.
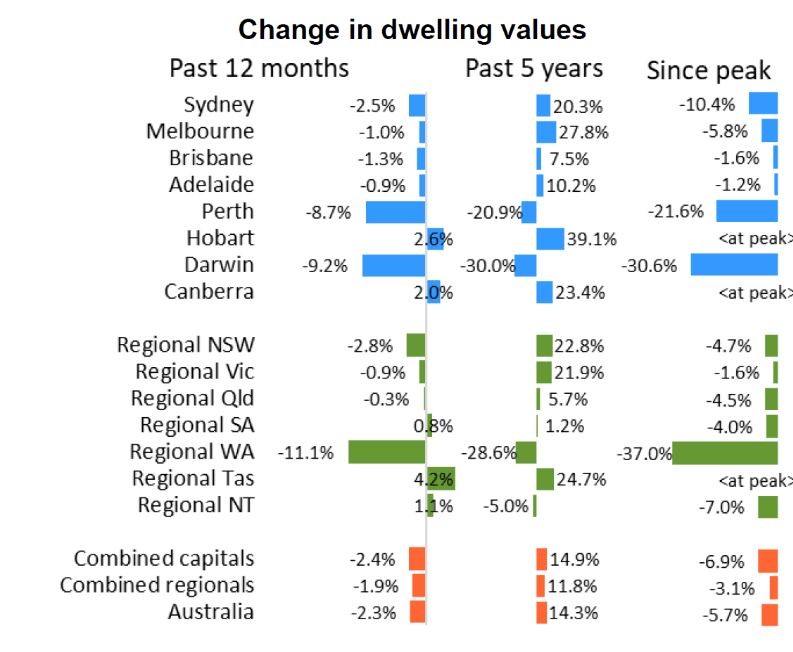
Since bottoming out in May, Sydney home values have recovered 5.3% of the 14.9% correction over the last few years.
Despite this rise, Sydney dwelling values are tracking around the same level as they were three years ago, however if they continue to grow as quickly as they have recently, they could reach new highs by the middle of next year.
House prices in Sydney rose 1.8% over the last month (+5.0% over the last quarter) while unit prices rose 1.2% (+4.2% over the last quarter.)
The recovery trend is most concentrated across the premium end of the housing market where values were previously falling more rapidly. Over the past three months properties in Sydney’s top quartile increased in value by 5.9% while properties in the lower quartile only increasing by 3.2%.
Although housing values are rising, rents are continuing to fall, down 0.1% in October to be 1.8% lower over the year.
However the following metrics confirm the Sydney housing market is steadily improving:
• The average selling time of a home is now 38 days (an improvement on 44 days a year ago) and
• Vendors are discounting their properties an average of 4.4% to affect a sale (6.2% a year ago)
• 6.8% fewer properties sold in the last 12 months compared to the previous year
Currently investors are abandoning the off the plan apartment sector for many reasons including concerns about construction standards, but many of those who purchased off the plan a few years ago are now having trouble settling with valuations coming in on completion at well below contract price at a time when banks are more reluctant to lend on these properties.
The beginning of this new cycle is a great time to look at buying an investment grade property in Sydney which is currently offering investors an opportunity to buy established apartments in the eastern suburbs, lower north shore and inner west at a discount to what they would have paid a number of years ago.
Melbourne Property Market
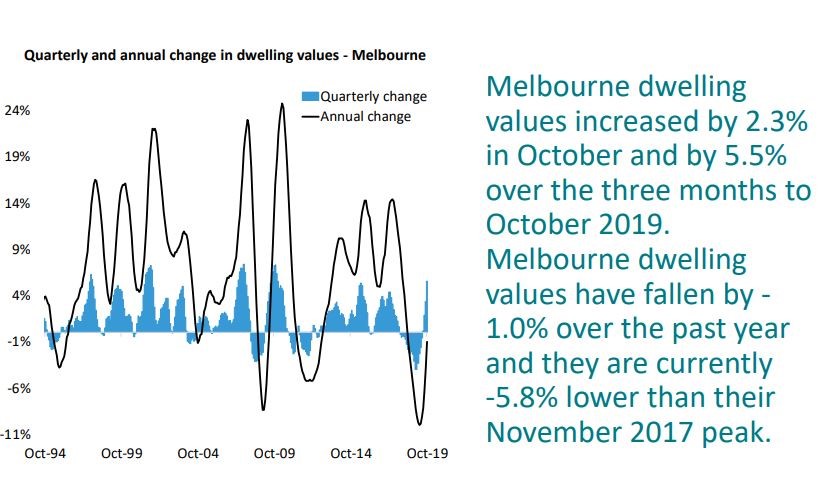
Melbourne’s house prices have regained more than half their losses of the recent property downturn exhibiting their quickest turnaround on record.
Values were up 2.3% in October, which was the largest month on month change since late 2009, taking the market 6% higher since finding a floor in May.
House prices in Melbourne rose 2.4% over the last month (+5.7% over the last quarter) while unit prices rose 2.0% (+5% over the last quarter.)
Melbourne’s premium value properties are leading the recovery trend, with values across the top quartile rising 7.1% over the three months ending October, compared with a 3.8% rise across the lower quartile.
The following metrics confirm the Melbourne housing market is progressively improving:
• The average selling time of a home is 32 days (33 days a year ago) and
• Vendors are discounting their properties an average of 4.4% to affect a sale (4.9% a year ago)
• 15.9% fewer properties sold in the last 12 months compared to the previous year
But the Melbourne property market is very fragmented, with values in the inner and middle ring suburbs picking up while the cheaper outer suburbs are still languishing.
Overall property values will be underpinned by a robust economy, jobs growth Australia’s strongest population growth and the influx of 35% of all overseas migrants.
Remember…Melbourne rates as one of the 10 fastest growing large cities in the developed world, with its population likely to increase by around 10% in the next 4 years.
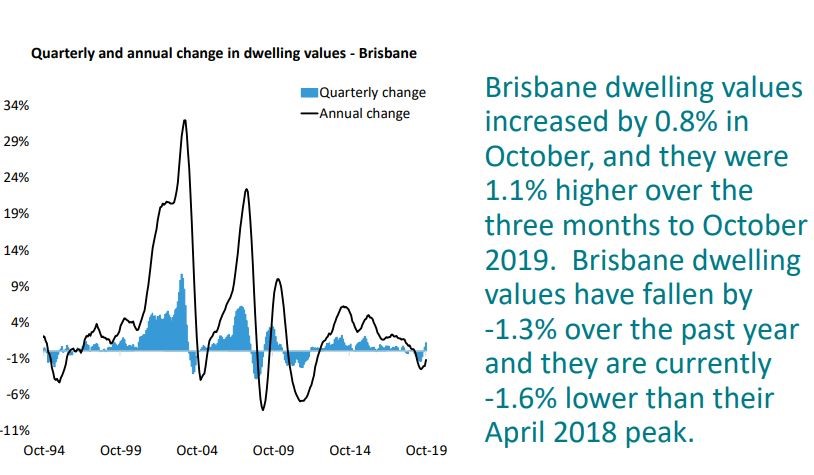
Brisbane Property Market
Brisbane’s property downturn has been quite shallow compared to the big two capital cities, with local values only 1.6% below their peak in April 2018.
But this followed a relatively mild growth cycle where growth in housing values in Brisbane averaged only 0.8% per annum over the past five years.
Now Brisbane values have posted their fourth consecutive month of subtle gains.
House prices in Brisbane rose 0.9% over the last month (+1.0% over the last quarter) while unit prices rose 0.8% (+1.7% over the last quarter.)
The following metrics show the Brisbane housing market is a little sluggish:
• The average selling time of a home is 59 days (38 days a year ago) and
• Vendors are discounting their properties an average of 4.6% to affect a sale (4.5% a year ago)
• 13.3% fewer properties sold in the last 12 months compared to the previous year
With migration rates lifting, supply under control and generally healthy levels of housing affordability, the Brisbane housing market fundamentals are looking healthier compared to most other capital cities.
At the same time the underlying strong demand from home buyers and investors from the southern States at a time when yields are attractive and housing affordability is relatively healthy and putting a floor under property prices.
Brisbane’s economy is being underpinned by major projects like Queen’s Wharf, HS Wharf, TradeCoast, Cross River Rail, the second airport runway and the Adani Coal Mine, but jobs growth from these won’t really kick off for a few more years.
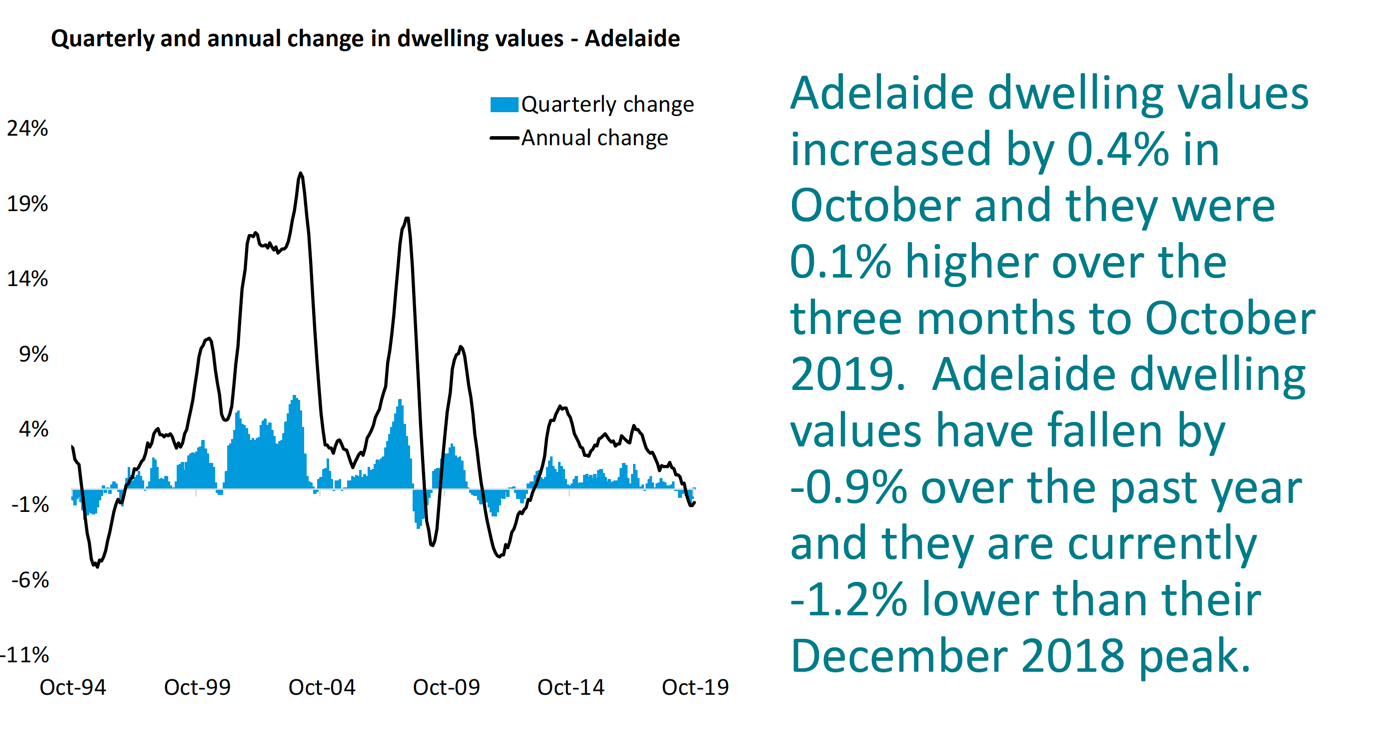
Adelaide Property Market
Adelaide housing values have been trended lower for much of this year, but recorded a 0.4% rise in October.
Adelaide’s housing downturn has been mild relative to most of the other capitals. Property roperty values peaked in Adelaide in December 2018 and since then dwelling values have fallen a modest 1.2% .
House prices in Adelaide rose 0.5% over the last month (+0.1% over the last quarter) while unit prices fell -0.4% (0% over the last quarter.)
Signs of the slower Adelaide property market include:
• The average selling time for a home is 53 days (up from 49 days a year ago)
• Vendors are discounting their properties an average of 5.6% to affect a sale (5.1% a year ago)
• 3.6% fewer properties sold in the last 12 months compared to the previous year
While things look reasonable for Adelaide property in the short term, over the next few decades the bulk of Australia’s long-term jobs growth, economic growth and population growth will occur in our 4 big capital cities meaning there are better locations for long term wealth creation that Adelaide.
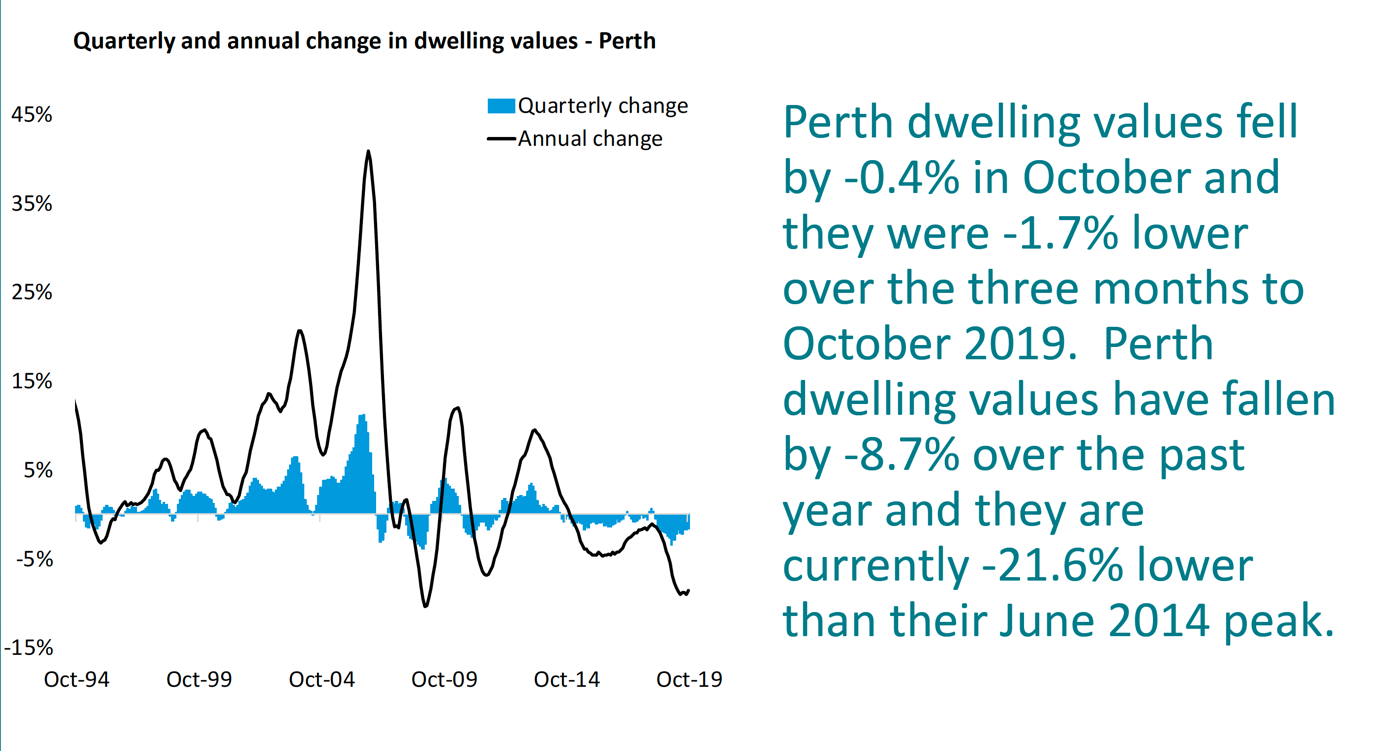
Perth Property Market
Perth has recorded a further reduction in dwelling values, down 0.4% over the last month and 8.7% lower over the past year, taking values 21.6% lower since peaking in June 2014.
House prices in Perth fell 0.4% over the last month (-1.8% over the last quarter) while unit prices fell -0.8% (-1.1% over the last quarter.)
The ongoing weakness in the Western Australian housing market can be attributed to mix of weak economic and demographic conditions overlaid with a lack of consumer confidence.
Perth is now the most affordable capital city, but it’s much too early for a countercyclical investment in the west – I can’t see prices rising significantly for a number of years.
However Perth’s rental markets have been tightening as housing demand increases, lifting Perth rents 2.4% higher over the past year.
Signs of the ongoing slump in the Perth housing market include:
• The average selling time of a home is 60 days (57 days a year ago) and
• Vendors are discounting their properties an average of 6.3% to affect a sale (6.7% a year ago)
• 4.5% fewer properties sold in the last 12 months compared to the previous year
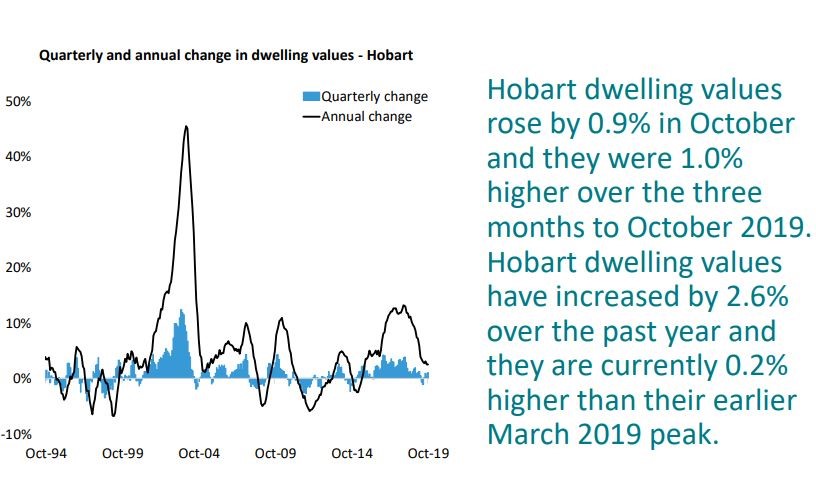
Hobart Property Market
While Hobart has been the best performing property market in the last three years, its boom is now over.
CoreLogic figures show prices are stabilising. House prices in Hobart rose 0.9% over the last month (+1.2% over the last quarter) while unit prices rose 1.0% (+0.2% over the last quarter.)
It’s likely the Hobart market will continue to lose its momentum moving forward.
Signs of the slowing Hobart property market include:
• The average selling time for a home is 26 days (11 days a year ago)
• Vendors are discounting their properties an average of 3.4% to affect a sale (3.2% a year ago)
• 7.1% fewer properties sold in the last 12 months compared to the previous year
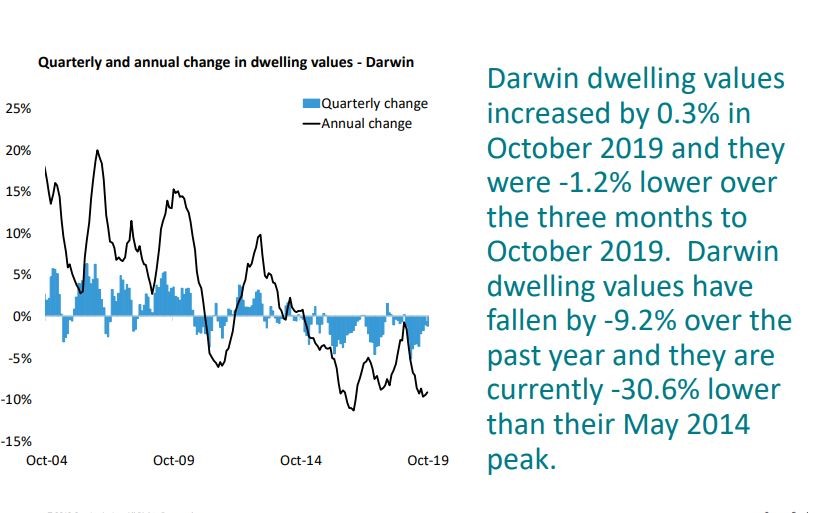
Darwin Property Market
The Darwin property market peaked in August 2010 is still suffering from the effects of the end of our mining boom with a very soft employment market and lack of migration and infrastructure spending.
House prices in Darwin rose 0.7% over the last month (-1.5% over the last quarter) while unit prices fell -0.4% (-0.5% over the last quarter.)
Currently values are 30.8% below their historic peak and it is unlikely we’ll see these types of house prices again in the next decade.
However there are signs that Darwin’s slump is easing a little:
• The average selling time for a home is 78 days (68 days a year ago) and
• Vendors are discounting their properties an average of 9.3% to affect a sale (7% a year ago)
• and a slight increase in number of sales in Darwin (4.2%) than 12 months ago
The small size of the Darwin market makes it more susceptible to local events and Darwin typically has a higher and more variable vacancy rate, a product of a large transient working population.
Darwin does not have significant growth drivers on the horizon and would be best avoided by investors.
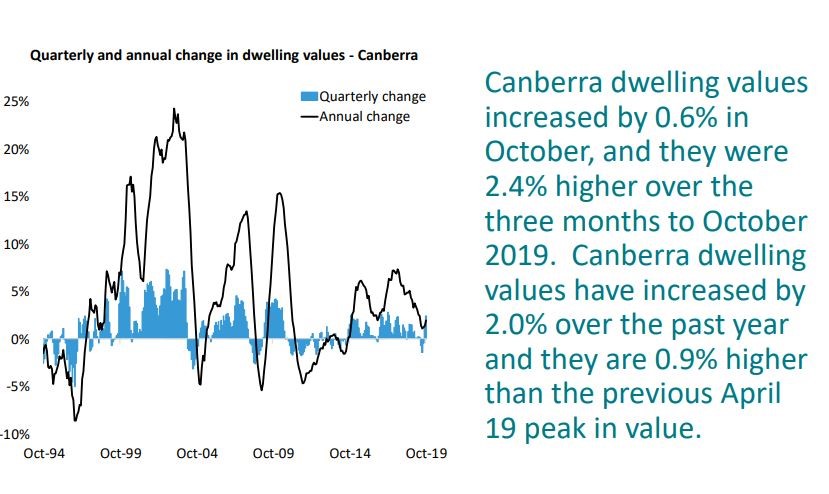
Canberra Property Market
Canberra’s property market has been a “quiet achiever” with dwelling values having grown 2% over the last year and have now reached a new peak.
House prices in Canberra rose 0.8% over the last month (+2.9% over the last quarter) while unit prices rose 0.1% (+0.4% over the last quarter.)
The following vendor metrics show the Canberra is performing a little more sluggishly than a year ago, but its steady growth should continue into 2020:
• The average selling time for a home is now 35 days (33 days a year ago) and
• Vendors are discounting their properties an average of 3.3% to affect a sale (2.3% a year ago)
• 9.2% fewer properties sold in the last 12 months compared to the previous year.
What’s ahead?
The Melbourne and Sydney property markets have surprised most commentators with the strength of their resurgence.
But what ahead for next year?
Well…even stronger price growth according to SQM Research’s annual Housing Boom and Bust Report which suggests that most of Australia’s capital cities will benefit from the interest rate cuts and loosening of credit restrictions to record dwelling price rises over 2020 with Sydney and Melbourne leading the charge.
SQM’s base case forecast is for dwelling prices to rise between 7% to 11%, which is a strong bounce back from the price falls recorded over 2018 and the first half of 2019.
Their base case forecasts assume no changes in interest rates and, importantly, no intervention by the Australian Prudential Regulation Authority (APRA).
SQM forecast Sydney property values to rise between 10% to 14% and Melbourne property prices to rise 11% to 15% next year
Other cities are also expected to record price rises.
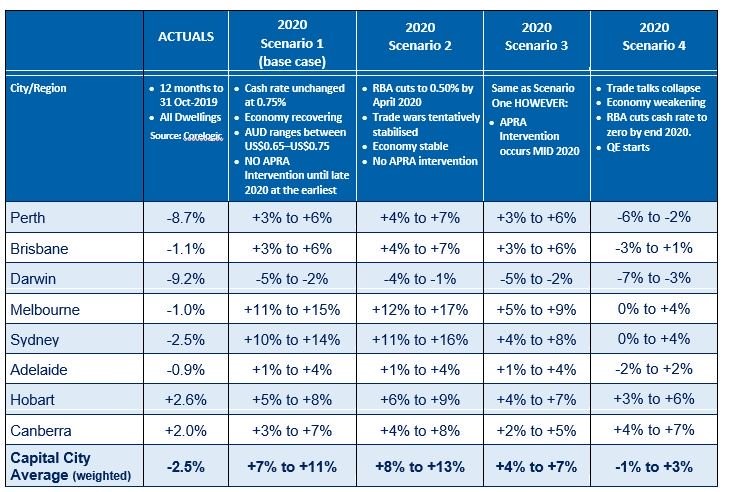
Source: SQM Housing Boom and Bust Report 2020
Source of all other graphs and data: CoreLogic
Michael Yardney is a director of Metropole Property Strategists, which creates wealth for its clients through independent, unbiased property advice and advocacy. He is a best-selling author, one of Australia’s leading experts in wealth creation through property and writes the Property Update blog.